
UNITED STATES
SECURITIES AND EXCHANGE COMMISSION
Washington, D.C. 20549
SCHEDULE 14A
Proxy Statement Pursuant to Section 14(a) of the Securities
Exchange Act of 1934 (Amendment No. )
Filed by the Registrantþ
Filed by a Party other than the Registranto¨
Check the appropriate box:
¨ | Preliminary Proxy Statement | |||
¨ | Confidential, for Use of the Commission Only (as permitted by Rule | |||
þ | Definitive Proxy Statement | |||
¨ | Definitive Additional Materials | |||
¨ | Soliciting Material Pursuant to §240.14a-12 | |||
Trinity Industries, Inc. | ||||
| (Name of Registrant as Specified In Its Charter) | ||||
| (Name of Person(s) Filing Proxy Statement, if other than the Registrant) | ||||
Payment of Filing Fee (Check the appropriate box): | ||||
þ | No fee required. | |||
¨ | Fee computed on table below per Exchange Act Rules 14a-6(i)(1) and 0-11. | |||
1) | Title of each class of securities to | |||
2) | Aggregate number of securities to which transaction applies: | |||
3) | Per unit price or other underlying value of transaction computed pursuant to Exchange Act Rule 0-11 (set forth the | |||
4) | Proposed maximum aggregate value of | |||
5) | Total fee paid: | |||
¨ | Fee paid previously with preliminary materials. | |||
¨ | Check box if any part of the | |||
1) | Amount Previously Paid: | |||
2) | Form, Schedule or Registration Statement No.: | |||
3) | Filing Party: | |||
4) | Date Filed: | |||

2525 Stemmons Freeway
Dallas, Texas75207-2401
www.trin.net
NOTICE OF ANNUAL MEETING OF STOCKHOLDERS
To Be Held on May 4, 2009April 30, 2012
TO: Trinity Industries, Inc. Stockholders:
Please join us for the 20092012 Annual Meeting of Stockholders of Trinity Industries, Inc. The meeting will be held at the principal executive offices of the Company, 2525 Stemmons Freeway, Dallas, Texas 75207, onMonday, May 4, 2009April 30, 2012,at 8:30 a.m., Central Daylight Time.
At the meeting, the stockholders will act on the following matters:
(1) Election of tenthe eleven nominees named in the attached proxy statement as directors;
(2) Advisory vote to approve named executive officer compensation;
(3) Ratification of the appointment of Ernst & Young LLP as the Company’s independent registered public accounting firm for the year ending December 31, 2009;2012; and
(4) Any other matters that may properly come before the meeting.
All stockholders of record at the close of business on March 20, 200916, 2012 are entitled to vote at the meeting or any postponement or adjournment of the meeting. A list of the stockholders is available at the Company’s offices in Dallas, Texas.
| By Order of the Board of Directors |
 |
| JARED S. RICHARDSON |
| Associate General Counsel and Secretary |
March 30, 2012

YOUR VOTE IS IMPORTANT!
Please vote as promptly as possible by using the internet or telephone or by signing, dating, and returning the enclosed proxy card to the address listed on the card.
Important Notice Regarding the Availability of Proxy Materials for the
Annual Meeting of Stockholders to be Held on May 4, 2009:
This Proxy Statement and the Annual Report to Stockholders for the fiscal year ended December 31, 2008,2011, are available for viewing, printing, and downloading atwww.proxydocs.com/trnhttps://materials.proxyvote.com/896522.
| Page | ||||
| 1 | ||||
| 2 | ||||
| 2 | ||||
| 3 | ||||
| 8 | ||||
| 8 | ||||
| 8 | ||||
| 9 | ||||
| 9 | ||||
| 9 | ||||
Advisory Vote to Approve Named Executive Officer Compensation | 12 | |||
| 53 | ||||
Security Ownership of Certain Beneficial Owners and Management | ||||
2525 Stemmons Freeway
Dallas, Texas75207-2401
www.trin.net
This Proxy Statement is being mailed on or about April 1, 2009March 30, 2012 to the stockholders of Trinity Industries, Inc. (“Trinity” or the(the “Company”) in connection with the solicitation of proxies by the Board of Directors of the Company to be voted at the Annual Meeting of Stockholders of the Company to be held at the offices of the Company, 2525 Stemmons Freeway, Dallas, Texas, on Monday, May 4, 2009,April 30, 2012, at 8:30 a.m., Central Daylight Time (the “Annual Meeting”), or at any postponement or adjournment thereof, for the purposes set forth in the accompanying Notice of Annual Meeting of Stockholders. The Company’s mailing address is 2525 Stemmons Freeway, Dallas, Texas, 75207.
You may vote in person by attending the meeting, by completing and returning a proxy by mail, or by using the Internetinternet or telephone. To vote your proxy by mail, mark your vote on the enclosed proxy card, then follow the instructions on the card. To vote your proxy using the Internetinternet or telephone, see the instructions on the proxy form and have the proxy form available when you access the Internetinternet website or place your telephone call.
The named proxies will vote your shares according to your directions. If you sign and return your proxy but do not make any of the selections, the named proxies will vote your sharesshares: (i) FOR the election of the teneleven nominees for Directorsdirectors as listed belowset forth in this Proxy Statement, (ii) FOR the approval, on an advisory basis, of the compensation of the Company’s named executive officers as disclosed in these materials, and (iii) FOR the ratification of Ernst & Young LLP as independent registered public accounting firm of the Company for the fiscal year ending December 31, 2009.2012. The proxy may be revoked at any time before it is exercised by filing with the Company a written revocation addressed to the Corporate Secretary, by executing a proxy bearing a later date or by attending the Annual Meeting and voting in person.
The cost of soliciting proxies will be borne by the Company. In addition to the use of postal services or the internet, proxies may be solicited by directors, officers, and regular employees of the Company (none of whom will receive any additional compensation for any assistance they may provide in the solicitation of proxies) in person or by telephone. The Company has hired Georgeson, Inc. to assist in the solicitation of proxies at an estimated cost of $10,000 plus disbursements.
The outstanding voting securities of the Company consist of shares of Common Stock,common stock, $1.00 par value per share.share (“Common Stock”). The record date for the determination of the stockholders entitled to notice of and to vote at the Annual Meeting, or any postponement or adjournment thereof, has been established by the Board of Directors as of the close of business on March 20, 2009.16, 2012. At that date, there were outstanding and entitled to vote 78,593,87980,245,108 shares of Common Stock.
The presence, in person or by proxy, of the holders of record of a majority of the outstanding shares entitled to vote is necessary to constitute a quorum for the transaction of business at the Annual Meeting, but if a quorum should not be present, the meeting may be adjourned from time to time until a quorum is obtained. A holder of Common Stock will be entitled to one vote per share on each matter properly brought before the meeting. Cumulative voting is not permitted in the election of directors.
The proxy card provides space for a stockholder to withhold voting for any or all nominees for the Board of Directors. The election of directors requires a plurality of the votes cast at the meeting. The ratification of the independent auditors requiresAll other proposals require the affirmative vote of a majority of the shares present in person or represented by proxy and entitled to vote at the meeting. Shares of a stockholder who abstains from voting on any or all proposals will be included for the purpose of determining the presence of a quorum. However, votesVotes withheld with respect to the election of the Company’s directors will not be counted either in favor of or against the election of the nominees. In the case of
the other proposal which isproposals being submitted for stockholder approval, an abstention will effectively count as a vote cast against such proposal. Broker non-votes on any matter, as to which the broker has indicated on the proxy that it does not have discretionary authority to vote, will be treated as shares not entitled to vote with respect to that matter. However, such shares will be considered present and entitled to vote for quorum purposes so long as they are entitled to vote on other matters.
The business affairs of Trinitythe Company are managed under the direction of the Board of Directors (also referred to in this proxy statement as the “Board”) in accordance with the General Corporation Law of the State of Delaware and the Company’s Certificate of Incorporation and Bylaws. The role of the Board of Directors is to oversee the management of the Company for the benefit of the stockholders. This responsibility includes monitoring senior management’s conduct of the Company’s business operations and affairs; reviewing and approving the Company’s financial objectives, strategies, and plans; risk management oversight; evaluating the performance of the chief executive officer and other executive officers; and overseeing the Company’s policies and procedures regarding corporate governance, legal compliance, ethical conduct, and maintenance of financial and accounting controls. The Board of Directors first adopted Corporate Governance Principles in 1998, which are reviewed annually by the Corporate Governance and Directors Nominating Committee and were last amended in December 2007.2011. The Company has a long-standing Code of Business Conduct and Ethics, which is applicable to all employees of the Company, including the chief executive officer, the chief financial officer, theand principal accounting officer, andas well as the Board of Directors. The Company intends to post any amendments to or waivers from its Code of Business Conduct and Ethics on the Company’s website to the extent applicable to the Company’s chiefan executive officer, chief financial officer, principal accounting officer or a director.director of the Company. The Corporate Governance Principles and the Code of Business Conduct and Ethics are available on the Company’s web site atwww.trin.netunder the heading “Investor Relations/Governance” or in print upon written request to the Corporate Secretary.
The directors hold regular and special meetings and spend such time on the affairs of the Company as their duties require. During 2008,2011, the Board of Directors held nineseven meetings. The Board also meets regularly in non-management executive sessions and selects the Presiding Director, forwho serves as the lead independent director and chairs the non-management executive sessions. Mr. Jess T. HayRhys J. Best currently serves in that capacity. Mr. Rhys J. Best will commence service as the Presiding Director immediately following the Annual Meeting. In 2008,2011, all directors of the Company attended at least 75% of the meetings of the Board of Directors and the committees on which they served.served, except for Mr. Ronald W. Haddock, who attended 71%. Mr. Haddock serves as interim chief executive officer for AEI Services, LLC, and his responsibilities included attending meetings for AEI Services, LLC that conflicted with some of the Company’s Committee meetings. The Company believes this was a temporary situation, and values Mr. Haddock’s service on the Board of Directors. It is Company policy that each of our directorsdirector is expected to attend the Annual Meeting. All of our directors were in attendance at the 20082011 Annual Meeting.
The Board of Directors makes all determinations with respect to director independence in accordance with the New York Stock Exchange The Board undertook its annual review of director independence and considered transactions and relationships between each director or any member of his or her immediate family and the Company and its subsidiaries and affiliates. In making its determination, the Board applied the amongst other things, considered transactions (i) between In 2011, the transactions In 2011, a subsidiary of the As a result of its review, the Board affirmatively determined that the following directors are independent of the Company and its management under the standards set forth in the Mr. Wallace serves as the Chairman, Chief Executive Officer, and President of the Company. As stated in the Corporate Governance Principles, the Board believes that While Mr. Wallace serves as both Chairman and Chief Executive Officer, all other directors are independent. After considering the recommendations of the Human Resources Committee, the independent directors determine Mr. Wallace’s compensation. Further, the Company has four standing committees and an independent Presiding Director. Mr. Wallace does not serve on any Board committee. The Board routinely holds executive succession planning discussions with the Vice President of Organizational Development and Mr. Wallace with respect to all executive officer positions. The Board believes that each of these measures helps to counter-balance any risk in having Mr. Wallace serve as both Chairman and Chief Executive Officer. For these reasons, the Board believes that this leadership structure is effective for the Company. Mr. Best currently serves as Presiding Director. The Presiding Director has the following roles and responsibilities: Serve as a member of the Corporate Governance and Directors Nominating Committee; Preside at each executive session of non-management and independent directors; Preside at all meetings when the Chairman and Chief Executive Officer is not present; As needed or appropriate, develop agendas for executive sessions of non-management and independent Serve as the principal liaison to advise the Company’s Chairman and Chief Executive Officer of Confer periodically with the To the extent that the Presiding Director is not the Chairman of the Corporate Governance and Directors Nominating Committee, the Presiding Director assists the Chairman of the Corporate Governance and Directors Nominating Committee in planning and executing each self-evaluation process of the Board; The standing committees of the Board of Directors are the Audit Committee, Audit Committee Corporate Governance & Directors Nominating Committee Finance & Risk Committee Human Committee John L. Adams Rhys J. Best David W. Biegler Leldon E. Echols Ronald J. Gafford Ronald W. Haddock Adrian Lajous Charles W. Matthews Diana S. Natalicio Douglas L. Rock Member Chair Audit Committee The Audit Committee’s function is to oversee the integrity of the Company’s financial statements and related disclosures; the Company’s compliance with legal and regulatory requirements; the qualifications, independence, and performance of the Company’s independent auditing firm; the performance of the Company’s internal audit function; the Company’s internal accounting and disclosure control systems; The functions of the Corporate Governance and Directors Nominating Committee (“Nominating Committee”) are to identify and recommend to the Board individuals qualified to be nominated for election to the Board; review the qualifications of the members of each committee (including the independence of directors) to ensure that each committee’s membership meets applicable criteria established by the SEC and NYSE; recommend to the Board the members and Chairperson for each Board committee; periodically review and assess the Company’s Corporate Governance Principles and the Company’s Code of Business Conduct and Ethics and make recommendations for changes thereto to the Board; periodically review the Company’s orientation program for new directors and the Company’s practices for continuing education of existing directors; annually review director compensation and benefits and make recommendations to the Board regarding director compensation and benefits; review, approve, and ratify all transactions with related persons that are required to be disclosed under the rules of the SEC; annually conduct an individual director performance review of each incumbent director; and oversee the annual self-evaluation of the performance of the Board. Each of the members of the In performing its annual review of director compensation, the The The name of the stockholder, evidence of the person’s ownership of Company stock, including the number of shares owned and the length of time of ownership, and a description of all arrangements or understandings regarding the submittal between the stockholder and the recommended candidate; and The name, age, business, and residence addresses of the candidate, the candidate’s résumé or a listing of his or her qualifications to be a director of the Company, and the person’s consent to be a director if selected by the Nominating Committee, nominated by the Board, and elected by the stockholders. The The Once a person has been identified by the Finance and Risk Committee The oversight duties of the Finance and Risk Committee (the “Finance Committee”) include periodically reviewing the Company’s financial status and compliance with debt instruments; reviewing and making recommendations to the Board regarding financings and refinancing and authorizing financings and refinancing within limits prescribed by the Board; reviewing and assessing risk exposure related to the Company’s operations; monitoring the funds for the Company’s benefit plans; reviewing the Company’s insurance coverages; and reviewing significant acquisitions and dispositions of businesses or assets and authorizing such transactions within limits prescribed by the Board. The Finance Committee met nine times in 2011. The Company periodically identifies, assesses, and risk rates the business, commercial, operational, financial, and other risks associated with its products and services. Human Resources Committee The Human Resources Committee (the “HR Committee”) Executive The HR Committee reviews management succession and The HR Committee hires independent executive compensation consultants to provide an assessment of the Company’s executive compensation The HR Committee retained the services of The HR Committee instructed review the total direct compensation (base salary, annual incentive, and long term incentive); confirm that the comparator companies selected by the HR Committee were appropriate; and gather publicly traded comparator company proxies and market surveys The Compensation Consultant benchmarked all components of compensation for The Role of Management The CEO, the CFO, and the implements compensation-related policies and procedures and oversees the execution of each plan. The HR Committee recommends to the independent directors Mr. Wallace’s compensation for their approval. The Role of the HR Committee The HR Committee The HR Committee realizes that Board’s Role in Risk Oversight The Risk Assessment of Compensation Policies and Practices The Company conducts a detailed risk assessment of its compensation policies and practices for its employees, including its executive officers. The Company’s Internal Audit group reviews the Company’s compensation policies and practices (the “Compensation Policies”), and meets with the Company’s management to discuss risks presented by the Compensation Policies. Based on these discussions, and a review of the Compensation Policies, the Internal Audit group assesses the likelihood and potential impact of the risk presented by the Compensation Policies. The Internal Audit group presents its findings to an internal committee consisting of a cross-section of corporate and business segment executives that meets quarterly to review identified risks and assess exposures. This committee considers the Messrs. Best, Echols, Gafford, Haddock, The Board has established a process to receive communications by mail from stockholders and other interested All communications received as set forth in the preceding paragraph will be opened by the office of The Board of Directors currently consists of Following a recommendation from the The Board of Directors believes that each of the director nominees possesses the qualifications described above in “Corporate Governance — Board Committees — Corporate Governance and Directors Nominating Committee.” That is, the Board believes that each nominee possesses: (i) deep experience at the policy making level in business, government or education, (ii) the ability to make a meaningful contribution to the Board’s oversight of the business and affairs of the Company, (iii) a willingness to exercise independent judgment, and (iv) an impeccable reputation for honest and ethical conduct in both his or her professional and personal activities. The information provided below is biographical information about each of the Mr. Wallace joined the Company in 1975. During his long tenure with the Company, Mr. Wallace has consistently shown strong performance in a variety of roles, requiring a wide range of business and interpersonal skills. He has provided excellent leadership to the Company in his current positions, exhibiting sound judgment and business acumen. John L. Adams, As a result of his past employment by the Company, Mr. Adams brings significant knowledge and understanding of the Company’s operations and business environment. In addition, he has experience as a senior executive in the banking industry, which provides the Board with experience in managing financing transactions. His service on the boards of other significant companies provides the Board with additional perspective on the Company’s operations. Rhys J. Best, Mr. Best has broad experience in managing and leading significant industrial enterprises. His service on the boards of other significant companies provides the Board with additional perspective on the Company’s operations, including its international operations and future international opportunities. David W. Biegler, Mr. Biegler has broad experience in managing and leading significant industrial Leldon E. Echols, retired. Prior to joining Centex, he spent 22 years with Arthur Andersen LLP and served as Managing Partner, Audit Practice for the North Texas, Colorado, and Oklahoma Region from 1997 — 2000. Mr. Echols is a In addition to having gained substantial managerial experience as an executive officer of Centex, Mr. Echols possesses important skills and Ronald J. Gafford, Mr. Haddock has broad experience in managing and Adrian Lajous, Mr. Lajous has broad experience in managing and Ms. Lovett has substantial managerial experience as an executive officer and business group president for TI. In addition, Ms. Lovett possesses skills and experience important to the Charles W. Matthews, 67. Director since 2010. Mr. Matthews is Chairman of the Nominating Committee and a member of the HR Committee. Mr. Matthews served Exxon Mobil Corporation, one of the leading global energy companies in the world, and its predecessor, Exxon Corporation, in several capacities in its legal department since 1971 before being appointed Vice President and General Counsel in 1995 until his retirement in 2010. He is a member of the board of directors of Cullen/Frost Bankers, Inc., a financial holding company and bank holding company. During his long employment at Exxon Mobil Corporation, Mr. Matthews accumulated broad experience in legal, managerial, and other matters in the energy industry around the world. Douglas L. Rock, 65.Director since 2010. Mr. Rock is a member of the Audit Committee and the HR Committee. From 1990 to August 2010, Mr. Rock served as the Chairman of the board of Smith International, Inc., an oilfield services company. Mr. Rock joined Smith International, Inc. in 1974 and served as Chief Executive Officer, President and Chief Operating Officer from 1989 — 2008. From 2004 — 2009, he served as a director of MoneyGram International, Inc., a payment service and money transfer business, and from 1999 — 2008 he served as a director of CE Franklin Ltd., a distributor of pipe, valves, flanges, fittings, production and process control equipment, tubular products and other general oilfield supplies to the Mr. Rock has broad experience in managing and leading a significant industrial enterprise. His recent service on the The Board of Directors recommends that you vote FOR all of the Nominees. The Company seeks approval, on an advisory basis, from its stockholders of the compensation of its named executive officers as described in this proxy statement. As discussed in the Compensation Discussion and Analysis section of this proxy statement, the Company’s long term strategic corporate vision is to be a premier multi-industry company that provides superior value to stockholders. The Board of Directors believes that realization of this vision depends in large measure on the talents of the Company’s employees. The Company’s compensation system plays a significant role in its ability to attract, motivate, and retain a high quality workforce. As described in the Compensation Discussion and Analysis, the Company’s executive compensation program (i) encourages high levels of performance and accountability, (ii) aligns the interests of executives with those of stockholders, (iii) links compensation to business objectives and strategies, and (iv) takes into account, as appropriate, the cyclical nature of the Company’s businesses. At the Company’s 2011 Annual Meeting, the Company held a stockholder advisory vote on the compensation of its named executive officers as described in the 2011 proxy statement, commonly referred to as a say-on-pay vote. The stockholders overwhelmingly approved the named executive officers’ compensation, with approximately 85% of the stockholders present and entitled to vote at the meeting voting in favor of the 2011 say-on-pay resolution. The Company believes this approval affirms the stockholders’ support of the Company’s approach to executive compensation. This proposal provides stockholders the opportunity to approve or not approve the Company’s executive compensation program through the following resolution: “Resolved, that the compensation paid to the Company’s named executive officers, as disclosed pursuant to Item 402 of Regulation S-K, including the Compensation Discussion and Analysis, compensation tables and narrative discussion is hereby approved.” Because this is an advisory vote, it will not be binding upon the Board of Directors. However, the HR Committee will take into account the outcome of the vote when considering future executive compensation arrangements. The Board of Directors recommends that you vote FOR approval of this resolution. PROPOSAL 3 — RATIFICATION OF THE APPOINTMENT OF ERNST & YOUNG LLP The Audit Committee has appointed Ernst & Young LLP (“Ernst & Young”) as independent registered public accounting firm of the Company for the fiscal year ending December 31, The Company has been advised by Ernst & Young that the firm has no relationship with the Company or its subsidiaries other than that arising from the firm’s engagement as auditors, tax advisors, and consultants. Ernst & Young, or a predecessor of that firm, has been the auditors of the accounts of the Company each year since 1958. The Company has also been advised that representatives of Ernst & Young will be present at the Annual Meeting where they will have an opportunity to make a statement if they desire to do so and will be available to respond to appropriate questions. The following table presents fees for professional audit services rendered by Ernst & Young for the audits of the Company’s annual financial statements for the years ended December 31, Audit fees Audit-related fees Tax fees All other fees Services rendered by Ernst & Young in connection with fees presented above were as follows: Audit Fees In fiscal years Audit-Related Fees Audit-related fees include fees for employee benefit plan audits, use of online research tools, and certain compliance audits. Tax Fees Tax fees in fiscal years All Other Fees All other fees consist of insurance claim services and government contract services. The insurance claim services related to the flooding at two of the Company’s barge facilities, one in Ashland City, Tennessee during 2010 and a second in Caruthersville, Missouri during 2011. These services include advising the Company of the appropriate methodologies for The Audit Committee pre-approves all audit and permissible non-audit services provided by Ernst & Young. These services may include audit services, audit-related services, tax services, and other services. The Audit Committee has adopted a policy for the pre-approval of services provided by Ernst & Young. In addition, the Audit Committee also may pre-approve particular services on acase-by-case basis. The Audit Committee has delegated pre-approval authority to the Chair of the Audit Committee. Pursuant to this delegation, the Chair must report any pre-approval decision by him to the Audit Committee at its first meeting after the pre-approval was obtained. Under this policy, pre-approval is generally provided for up to one year, and any pre-approval is detailed as to the particular services or category of services and includes an anticipated budget. We are a standing committee comprised of independent directors as “independence” is currently defined by SEC regulations and the applicable listing standards of the NYSE. We annually select the Company’s independent auditors. That recommendation is subject to ratification by the Company’s stockholders. Management is responsible for the Company’s internal controls and the financial reporting process. The independent auditors are responsible for performing an independent audit of the Company’s consolidated financial Consistent with our charter responsibilities, we have met and held discussions with management and the independent auditors. In this context, management and the independent auditors represented to us that the Company’s consolidated financial statements for the fiscal year ended December 31, The Company’s independent auditors have also provided to us the written disclosures and the letter required by applicable requirements of The Public Company Accounting Oversight Board regarding the independent auditor’s communications with the Audit Committee, and we discussed with the independent auditors that firm’s independence. We also considered whether the provision of non-audit services is compatible with maintaining the independent auditors’ independence and concluded that such services have not impaired the auditors’ independence. Based upon our reviews and discussions with management and the independent auditors and our review of the representation of management and the report of the independent auditors to the Audit Committee, we recommended that the Board of Directors include the audited consolidated financial statements in the Company’s Annual Report onForm 10-K for the year ended December 31, Audit Committee Leldon E. Echols, Chairman David W. Biegler Ronald W. Haddock Adrian Lajous Douglas L. Rock The Board of Directors recommends that you vote FOR the ratification of the appointment of Ernst & Young LLP as the Company’s independent registered public accounting firm for the fiscal year ending December 31, The Executive Summary The Company is Objectives of The primary emphasis of the Company’s executive compensation programs is to encourage and reward achievement of the Company’s annual and long-term business goals. Those goals are set by management, with oversight of the Board of Directors, and are designed to promote sustainable growth in stockholder value. As stockholders themselves, the Company’s leaders are keenly focused on achieving these goals. The executive compensation programs reflect the Company’s pay for performance philosophy. The HR Committee’s attract, motivate, and retain the key executives needed to enhance the performance and profitability of the Company; encourage the highest level of performance and accountability for the overall success of the Company; provide an incentive for long-term value creation for stockholders; align compensation with short-term and long-term business objectives and strategies, financial targets, and the core values of the Company; and take into account as appropriate the cyclical nature of the Company’s businesses. Role of Stockholder Say on Pay Votes In May 2011, the Company held a stockholder advisory vote on the compensation of its named executive officers as described in the 2011 proxy statement, commonly referred to as a say-on-pay vote. The stockholders overwhelmingly approved the named executive officers’ compensation, with approximately 85% of the stockholders present and entitled to vote at the meeting voting in favor of the 2011 say-on-pay resolution. As the Company evaluated its compensation practices and talent needs throughout 2011, it was mindful of the strong support stockholders expressed for its pay for performance compensation philosophy. As a result, following its annual review of executive compensation, the HR Committee decided to maintain a consistent approach to executive compensation, with an emphasis on short- and long-term incentive compensation that rewards senior executives for delivering value for stockholders. In addition, the HR Committee considered ways to strengthen the pay for performance culture at the Company. In determining how often to hold a stockholder advisory vote on executive compensation, the Board of Directors took into account the strong preference for an annual vote expressed by stockholders at the 2011 Annual Meeting. Accordingly, the Board of Directors determined that the Company will hold an annual advisory stockholder vote on executive compensation until the next say-on-pay frequency vote. Design of The Company’s executive compensation provide a reasonable balance between short-term and long-term compensation; provide a reasonable mix of fixed and incentive-based compensation; retain key executives through the cycles of the Company’s businesses; be competitive based on market survey data and peer group proxy disclosure data; use equity-based awards, stock ownership guidelines, and annual incentives that are linked to stockholder interests; and be transparent and easy to understand by the programs’ participants and the Company’s stockholders. Components of Compensation The executive compensation a an executive perquisite payment; an annual incentive plan designed to focus executives on the Company’s a long-term incentive plan designed to encourage executives to promote the The HR Committee past and expected future performance with respect to specific financial, strategic, and operating objectives; the breadth, complexity, and scope of each executive’s responsibilities within the Company; the executive’s value to the Company; a review of peer group proxy disclosure data; and market survey data against which compensation is benchmarked. The HR Committee realizes that The HR Committee generally targets total compensation for the named executive officers A named executive officer’s a base salary; an executive perquisite payment; and annual incentive compensation. A named executive officer’s A named executive officer’s long-term compensation consists of four primary components: incentive compensation that typically consists of annual equity awards with long-term vesting and/or multi-year performance periods; retirement benefits; deferred compensation; and pre-planned, transitional compensation. A named executive officer’s long-term compensation (the sum of the long-term components listed above) generally falls within a range of 40% to Fixed Versus Incentive-Based Compensation The Company combines both fixed and incentive-based compensation success of the Company as a whole and annual incentives typically paid in cash; and long-term incentives typically made through equity awards. Incentive-based target compensation (including both short-term and long-term compensation) is generally within a range of 60% to 80% of a named executive officer’s total target compensation. The HR Committee believes that this range is appropriate and sufficient to attract, motivate, and retain the key executives needed to enhance the profitability and performance of the Company. The percentage of compensation that is incentive-based increases as a named executive officer’s scope of responsibilities increases. As Chairman, Chief Executive Officer, and President of the Company, Mr. Wallace has a unique and The Board of Directors has delegated to the HR Committee oversight of the Company’s executive compensation programs. The HR Committee reviews and recommends the compensation for the CEO to the independent directors for their approval. The HR Committee reviews and approves the compensation of the other named executive officers. The five named executive officers for 2011 were: Timothy R. Wallace, Chairman, Chief Executive Officer, and President James E. Perry, Senior Vice President and Chief Financial Officer D. Stephen Menzies, Senior Vice President and Group President William A. McWhirter, Senior Vice President and Group President S. Theis Rice, Senior Vice President, Human Resources and Chief Legal Officer Analysis through Benchmarking and Peer Group Proxy Disclosure Data The HR Committee retains the Compensation Consultant to provide the HR Committee with guidance on executive compensation-related matters and to perform an annual total compensation study, including benchmarking information on each of the named executive officers. During 2010 and 2011, the Compensation Consultant provided guidance pertaining to 2011 and 2012 base salaries, annual incentive compensation, and long-term incentive compensation for executives. The compensation study included published market surveys and peer group proxy disclosure data. The benchmarks for the 25th percentile, the 50th percentile (market median), and 75th percentile were derived from market survey data. The HR Committee selected peer companies from which to compare proxy disclosure data based on criteria that included: industry (manufacturing and industrial); size (based on revenues, assets, market capitalization, and total number of employees); competition (companies that potentially compete with the Company for executive talent); and comparable executive positions (companies with executive positions with similar breadth, complexity, and scope of responsibility). A review of peer group proxy disclosure data was conducted for each of the named executive officers as shown in Table 1. This table depicts companies with revenues ranging between +50% and -50% of the Company’s average 2008 and 2009 revenue of $3.2 billion or asset values ranging between +50% and -50% of the Company’s average 2008 and 2009 asset value of $4.8 billion. An average of two years data for the Company is used to mitigate cyclicality effects on the Company’s businesses. Table 1 — Peer Companies Used in 2011 for Proxy Statement Disclosure Data by Named Executive Officer D. Stephen Menzies William A. McWhirter S. Theis Rice AMETEK, Inc. Briggs & Stratton Corporation Chicago Bridge & Iron Company N.V. Crane Co. Dover Corporation Flowserve Corporation Harsco Corporation Leggett & Platt, Incorporated Martin Marietta Materials, Inc. Roper Industries, Inc. Stanley Black & Decker Teleflex Incorporated Terex Corporation The Timken Company Vulcan Materials Company Worthington Industries, Inc. Total Peer Companies As noted in Table 1, there were 16 peer companies. Mr. Wallace’s position was compared against 14 of the 16 companies and was not compared against Dover Corporation or Flowserve Corporation because both had new CEOs at the time of the peer group proxy review. The positions of Messrs. Menzies and McWhirter were not compared against Briggs & Stratton Corporation or Roper Industries, Inc. because these entities did not report comparable operational positions. Messrs. Menzies and McWhirter were also compared to Cooper Industries plc because it had comparable operational positions even through the company as a whole was outside the revenue range for the peer group. Mr. Rice’s position was compared against four peer companies because his position was not included in the named executive officer disclosure of the other peer companies. In addition to the peer group proxy statement data, base salary, annual incentive compensation, and long-term incentive compensation data was obtained from a combination of the following published survey sources:Mercer 2010 Executive Compensation Survey,Towers Watson Executive Compensation Survey 2010, andHewitt TCM Online Executive, United States 2010 Survey. All the named executive officers were matched to comparable survey positions in the Durable Goods Manufacturing Industry at the appropriate revenue range. Based on the Hewitt U.S. Salary Increase Survey 2010/2011, all published survey data was time-adjusted to January 1, 2011 using the survey-based annual adjustment factor of 3%. Analysis for Each Component of Pay For each named executive officer, the Compensation Consultant determined an overall 25th percentile, 50th percentile (market median), and 75th percentile derived from the relevant published survey sources. The base salary, annual incentive compensation target, and long-term incentive compensation target of each named executive officer for 2011 were compared to the 25th, 50th and 75th percentiles. Following the analysis of these components of pay, the Compensation Consultant met with Company management, including the CEO, to discuss similarities and differences in responsibilities between the Company’s named executive officer positions and those in the surveys that could affect the levels of compensation components. After these discussions and a review of the data from the peer group, the Compensation Consultant provided comparative market information for each executive position. The Compensation Consultant’s analyses, along with the CEO’s compensation recommendations for each named executive officer other than himself, were presented to the HR Committee. 2011 Total Target Compensation In establishing 2011 total target compensation for the named executive officers, the HR Committee considered individual performance, responsibilities, motivation to drive results, internal compensation equity, market comparisons, and Mr. Wallace’s recommendations. Taking these factors into account, the HR Committee established the 2011 total target compensation for each named executive officer as set forth in Table 2. See “Components of Compensation” for further discussion on the establishment of each component of compensation. As illustrated in Table 2 below, all components of target compensation for 2011 for the named executive officers were within +/-26% of the 50th percentile (market median). Compensation adjustments for 2011 were based on past and expected future performance, scope of responsibilities, and value to the Company, taking into account peer group proxy disclosure data and comparative market survey data. The 2011 compensation adjustments for base salary, target annual incentive compensation, and target long-term incentive compensation positioned the named executive officers with respect to the 50th percentile as follows: Mr. Wallace from -19.9% to -9.6%; Mr. Perry from -47.0% to -26.0%; Mr. Menzies from +4.6% to +22.6%; Mr. McWhirter from -10.4% to +2.2%; and Mr. Rice from -20.9% to +21.3%. Mr. Perry’s total target compensation was below the 50th to 75th percentile target range as he was relatively new in his role. Mr. Menzies’ total target compensation was slightly above this targeted range as he is a seasoned executive with seniority in his role and has extensive work experience in similar roles outside the Company. Mr. Rice’s total target compensation was slightly above the targeted range as he is a seasoned executive with seniority in his role and has taken on additional responsibility for the human resources function. Mr. Wallace’s total target compensation was below the targeted range given his requests over the past several years to limit his compensation. The HR Committee believes that the 2011 total target compensation levels for the named executive officers were appropriate. Table 2: Total Target Compensation Table 2: The bars reflect total target compensation for 2011 as compared to the 25th, 50th and 75th market data percentiles from the surveys. The percentages shown in the table are calculated using the following formula: 2011 total target compensation divided by market total target compensation dollar amount for the 25th, 50th and 75th percentiles. Components of Compensation Set forth below are the Base Salary Base salary is intended to In establishing 2011 base Mr. Perry received a base salary increase in 2011 in recognition of his Taking these factors into account, 2011 base salaries for the named executive officers were established as set forth in Table 3, which reflects the comparison of the 2011 base salaries for the Company’s named executive officers to the base salaries from the relevant published survey sources. The compensation adjustments for base salary made for 2011 positioned the named executive officers with respect to the 50th percentile as follows: Mr. Wallace no change at his request; Mr. Perry from -31.6% to -26.4%; Mr. Menzies from +18.3% to + 22.9%; Mr. McWhirter from -3.3% to +2.4%; and Mr. Rice from -7.2% to +1.7%. Mr. Perry’s base salary was Table 3: Base Salary Table 3: The bars reflect base pay for 2011 as compared to the 25th, 50th, and 75th market data percentiles from the surveys. The percentages shown in the table are calculated using the following formula: 2011 base salary divided by market base salary dollar amount for the 25th, 50th, and 75th percentiles. 2012 Base Salary Mr. Wallace evaluated each of the named executive officers with respect to individual performance, responsibilities, motivation to drive results, internal compensation equity, and market comparisons. Based on the HR Committee’s review of compensation factors and Mr. Wallace’s recommendations, the 2012 base salaries were established. At Mr. Wallace’s request, his base salary was unchanged. The 2012 base salary for each named executive officer is as follows: Mr. Wallace $950,000; Mr. Perry $425,000; Mr. Menzies $556,000; Mr. McWhirter $480,000; and Mr. Rice $416,000. Mr. Perry received a base salary increase in Executive Perquisite Allowance The Executive Perquisite Allowance replaces traditional benefits for executives such as The amount of the Executive Perquisite Allowance each year is a specified percentage of base salary. The percentage is performance-related and is determined annually by the HR Committee. In establishing the percentage, the HR Committee reviews and considers the Company’s performance in the past year and the business plan for the coming year. The HR Committee may increase the Executive Perquisite Allowance when it believes the Company is in a period of year-to-year sustained growth or increased earnings. For 2011, the HR Committee approved maintaining the Executive Perquisite Allowance at 7.5% of base salary based on the Company’s 2010 earnings. Based on the Company’s 2011 earnings and the expectation of strong growth in 2012, the HR Committee approved increasing the 2012 Executive Perquisite Allowance to 10% of base salary. Additional information on the value of perquisites offered to each named executive officer in In establishing short-term (annual) and long-term incentive compensation programs and respective performance levels, the HR Committee follows a consistent process and philosophy, and takes into account the overall business environment facing the Company. The HR Committee believes that incentive compensation should drive improvement in Once the HR Committee has established performance levels for incentive compensation, it receives regular updates throughout the year regarding the Company’s progress with respect to the performance levels and potential payouts under the incentive compensation programs. The HR Committee also continually assesses whether it believes the programs are The Annual Incentive Compensation Program (referred to as “AIP”) is an integral component of accountability for the success of the Company as The The HR Committee may adjust, from year to year, the performance 2011 Annual Incentive Compensation In performing its annual assessment of the Company’s incentive compensation programs, the HR Committee determined that the 2010 AIP was highly effective in focusing executive attention on earnings per share (“EPS”). The HR Committee believed that continuing to emphasize EPS was important as the Company began to recover from the significant business downturn and a corresponding decrease in EPS. Accordingly, the HR Committee approved EPS as the exclusive performance metric for the Company’s 2011 AIP. Consistent with the HR Committee’s philosophy, during 2011, the AIP utilized the same performance levels and EPS metric for all participants. In establishing 2011 annual incentive compensation targets for the named executive officers, the HR Committee considered responsibilities, motivation to drive results, internal compensation equity, market comparisons, and Mr. Wallace’s recommendations. The HR Committee determined it is appropriate for the named executive officers, excluding the CEO, to have the same percentage of annual incentive compensation potential since they share responsibility for the Company’s achievement of its goals. As a result of (i) the position of his compensation as compared to market, (ii) his request that his base salary not be increased, and (iii) the HR Committee’s desire to recognize his performance, Mr. Wallace’s 2011 annual incentive compensation target was adjusted from 90% to 100% of his base salary. To recognize comparable levels of responsibility and to achieve internal compensation equity with respect to the AIP, the annual incentive compensation targets of the remaining named executive officers were adjusted to a common target of 75% of their respective base salaries. Mr. Wallace’s potential annual incentive compensation is greater since he has ultimate responsibility for the overall success of the Company. Table 4 reflects the 2011 target annual incentive compensation for the Company’s named executive officers as compared to the target annual incentive compensation from the relevant published survey sources. The compensation adjustments for annual incentive compensation targets positioned the named executive officers with respect to the 50th percentile as follows: Mr. Wallace from -24% to -15.5%; Mr. Perry from -41.4% to -21.1%; Mr. Menzies from +1.4% to +31.6%; Mr. McWhirter from +3.6% to +9.7%; and Mr. Rice from -24.0% to +25.0%. Mr. Perry’s annual incentive compensation target was below the 50th to 75th percentile target range as he was relatively new in his role. Mr. Menzies’ annual incentive compensation target was above this targeted range as he is a seasoned executive with seniority in his role and has extensive work experience in similar roles outside the Company. Mr. Rice’s annual incentive compensation target was above the targeted range as he is a seasoned executive with seniority in his role and has taken on additional responsibility for the human resources function. Mr. Wallace’s annual incentive compensation target was below the targeted range given his requests over the past several years to limit his compensation. Table 4: Target Annual Incentive Compensation Table 4: The bars reflect target annual incentive compensation for 2011 as compared to the 25th, 50th and 75th survey market data percentiles. The percentages shown in the table are calculated using the following formula: 2011 target incentive compensation divided by market target incentive compensation dollar amount for the 25th, 50th and 75th percentiles. As noted above, in 2011, the Company’s AIP was designed to focus participants on a common financial goal, EPS. During periods in which the Company anticipates strong growth in revenues and earnings, the HR Committee believes it appropriate to establish performance metrics reflective of such growth. In accordance with this principle, and given the anticipated recovery as the Company emerged from a deep decline in revenues and earnings, the HR Committee established the 2011 AIP performance levels as follows: (i) threshold at $0.90 of EPS, representing an achievable 6% growth in EPS over the prior year; (ii) target at $1.20 of EPS, representing a considerable but reasonable 40% growth in EPS over the prior year; and (iii) maximum at $1.50 of EPS, representing an aggressive 75% growth in EPS over the prior year. Table 5 reflects annual incentive compensation payouts as a percent of base salary for attainment of these performance metrics: Table 5: 2011 Annual Incentive Program Earnings Per Share (EPS) CEO All other Named Executive Officers Participants’ percentage payouts were set at 20%, 50%, and 100% of their respective maximum annual incentive pay for threshold, target, and maximum performance, respectively. The Company’s reported EPS in 2011 was $1.77, which included EPS of $0.12 that was attributable to the gain from flood insurance proceeds, net of deductibles. The HR Committee exercised its discretion to remove this non-recurring item of income for purposes of calculating incentive compensation. With the removal of this item, the Company’s EPS was $1.65, which exceeded the maximum EPS performance level of $1.50. Accordingly, the named executive officers received their respective maximum annual incentive compensation amounts. The 2011 annual incentive compensation amounts paid to each named executive officer were as follows: Mr. Wallace $1,900,000; Mr. Perry $525,000; Mr. Menzies $810,000; Mr. McWhirter $675,000; and Mr. Rice $600,000. In addition, Messrs. Perry and McWhirter were each awarded additional special cash bonuses of $50,000 in March 2011 in recognition of their added responsibilities in 2010 and the quality of their job performance throughout 2010. The HR Committee was pleased with the Company’s growth and financial performance in 2011, and believed that the 2011 AIP performed well by motivating the program participants to grow the Company’s earnings. Setting 2012 Annual Incentive Compensation Performance Levels At its meetings throughout 2011, the HR Committee received regular updates on the financial performance of the Company and the related potential payouts to the named executive officers, and monitored the degree of difficulty in achieving the various performance levels. At the end of 2011, the HR Committee reviewed the Company’s performance and was pleased with the results. The Company achieved 2011 EPS of $1.65 (as calculated above for annual incentive compensation purposes), representing growth of 94% over 2010 EPS. The HR Committee determined that continued focus on EPS growth was desirable and therefore again established EPS as the For 2012, the It is important to note that 2012 Annual Incentive Compensation Targets In performing its annual assessment of the Company’s incentive compensation programs, the HR Committee determined that the annual incentive compensation payout percentages established in 2011 provided the desired motivation for the named executive officers. Accordingly, for 2012 there are no changes to the annual incentive compensation payout percentages for the named executive officers. For 2012, Mr. Wallace’s annual incentive compensation target will remain at 100% of his base salary. The 2012 annual incentive compensation targets for each of the other named executive officers will remain at 75% of their respective base salaries. See the “Grants of Plan-Based Awards Table” for more information on possible future payments to the named executive officers. Long-Term Incentive Compensation Long-term incentive compensation (referred to as “LTI”) is a key part of the total target compensation for executives and is provided through the stockholder-approved stock option and incentive plan. The overarching purpose of LTI The LTI program accomplishes this purpose by linking incentives to long-term improvements for the Company. Each year, management reviews the Company’s strategic objectives with the Board of Directors and prepares a multi-year assessment of the business environment and the Company’s outlook. The HR Committee uses this information as a guide when establishing the target level performance goals for the performance-based LTI compensation program. The LTI program consists of two components: performance-based awards, which are earned based on As with the AIP, the HR Committee establishes threshold, target, and maximum financial performance levels to determine potential performance-based LTI. The HR Committee believes that each of these levels should be appropriately difficult to achieve and reflect the Company’s multi-year business environment and outlook. The HR Committee believes that (i) the threshold performance level should require a level of achievement appropriate for earning initial amounts of LTI, (ii) the target performance level should represent a considerable but reasonable level of performance improvement, and (iii) the maximum performance level should represent an aggressive level of performance improvement that will be highly difficult to achieve. For calculation purposes, the named executive officers become eligible to receive performance-based LTI when the threshold performance level is met. For Company performance falling between the specified performance levels, the amount of LTI awarded is prorated. The HR Committee establishes a target level of long-term incentive compensation (the “target LTI”) value for the named executive officers. This value is calculated as a percentage of each named executive officer’s base salary. The target LTI represents the amount of compensation that will be used to calculate the named executive officer’s respective LTI. The target LTI amount is converted into equity awards at the time of grant based on a stock price calculation. Due to the cyclical nature of the Company’s business and the related impact on its stock price, the HR Committee directed management to use the trailing one-year average stock price to determine the number of shares or stock units in a participant’s grant. A named executive officer’s target LTI grant can be composed of three types of long-term incentives: (i) performance-based restricted stock or stock units; (ii) retention-based restricted stock or stock units; and (iii) stock options. The HR Committee establishes guidelines for the ratio that it expects to award through restricted stock, stock units, or stock options. For 2011 grants, 75% of the named executive officers’ target LTI was allocated to performance-based restricted stock or stock units and 25% was allocated to retention-based restricted stock or stock units. For 2012 grants related to the 2010-2011 performance period, this allocation remained the same. For grants related to the 2012-2014 performance period, 100% of their target LTI will be allocated to performance-based restricted stock units.The HR Committee is making this change to more closely align LTI with the Company’s performance. The HR Committee may continue to make retention-based awards to named executive officers if it determines that such awards will be helpful in retaining the officers. In making this determination, the HR Committee will consider a number of factors, including the amount of retention-based awards already made to the officers, the officers’ tenure with the Company, and the officers’ performance in their respective roles. 2011 Long-Term Incentive Compensation Targets In establishing 2011 target LTI for the named executive officers, the HR Committee considered responsibilities, motivation to drive results, internal compensation equity, market comparisons, and Mr. Wallace’s recommendations. The HR Committee determined it is appropriate for the named executive officers, excluding the CEO, to have the same percentage of LTI at risk since they share responsibility for the Company’s achievement of its goals. To recognize comparable levels of responsibility and to achieve internal compensation equity with respect to the LTI program, the target LTI of the named executive officers, excluding the CEO, was adjusted to a common target of 175% of their respective base salaries. As a result of (i) the position of his compensation as compared to market, (ii) his request that his base salary not be increased, and (iii) the HR Committee’s desire to recognize his performance, Mr. Wallace’s target LTI was adjusted from 300% to 325% of his base salary. Mr. Wallace’s potential LTI is greater since he has ultimate responsibility for the overall success of the Company. Table 6 reflects the 2011 target LTI for the Company’s named executive officers as compared to the target LTI from the relevant published survey sources. The compensation adjustments for target LTI positioned the named executive officers with respect to the 50th percentile as follows: Mr. Wallace from -21.9% to -7.8%; Mr. Perry -56.2 to -24.9%; Mr. Menzies from +1.4% to +22.8%; Mr. McWhirter from -17.2% to +2.3%; and Mr. Rice from -26.2% to +41.6%. Mr. Perry’s target LTI was below the 50th to 75th percentile target range as he was relatively new in his role. Mr. Wallace’s target LTI was below the targeted range given his requests over the past several years to limit his compensation. Table 6: Target Long-Term Incentive Compensation Table 6: The bars reflect 2011 target LTI as compared to the 25th, 50th, and 75th survey market data percentiles. The percentages shown in the table are calculated using the following formula: 2011 target LTI divided by market target LTI dollar amount for the 25th, 50th, and 75th percentiles. 2012 Long-Term Incentive Compensation Targets In performing its annual assessment of the Company’s incentive compensation programs, the HR Committee determined that the target LTI payout percentages established in 2011 were providing the desired motivation for the named executive officers. Accordingly, for 2012 there are no changes to the target LTI for the named executive officers. For 2012, Mr. Wallace’s target LTI compensation will remain at 325% of his base salary. The 2012 target LTI for each of the other named executive officers will remain at 175% of their respective base salaries. See the “Grants of Plan-Based Awards Table” for more information on possible future payments to the named executive officers. Long-Term Incentive Compensation Programs Beginning in 2006, the HR Committee implemented a long-term incentive program that grants performance-based restricted stock, following performance periods of two or three years (the “P.B. Restricted Stock Program”). The Company’s performance during the performance periods is used to determine the size of the grant for each participant in the P.B. Restricted Stock Program. Under this program, following the conclusion of the performance periods, if the performance goals are achieved, the HR Committee In 2010, the Compensation Consultant recommended to the HR Committee, and the HR Committee initiated the transition to, a new type of performance-based restricted stock unit program (the “P.B. Unit Program”). The P.B. Unit Program, which began in 2011, is more widely used by the Company’s peer group. The P.B. Unit Program is designed to increase the visibility of the long-term incentive performance goals for the program’s participants, align their efforts toward achieving these goals, more closely match the Company’s expense related to the program with the performance period, and reinforce pay for performance linkage through settlement of awards immediately following the end of the relevant performance period. The P.B. Unit Program is designed to accomplish these goals by granting performance-based restricted stock units at pre-established target levels at the beginning of a three-year performance period. The Company’s attainment of the performance goals during the performance period determines the number of units that are ultimately earned and converted into shares of Common Stock at the end of the performance period. As a result of transitioning to this new approach in 2011, a short-term overlap exists between the pre-existing P.B. Restricted Stock Program and the newer P.B. Unit Program. The HR Committee determined it would be better to phase in the new P.B. Unit Program over the next three years rather than cancelling the pre-existing P.B. Restricted Stock Program. P.B. Restricted Stock Program Grants in 2011 For the three-year performance period beginning in 2008 and ending in 2010, the Company did not achieve the P.B. Restricted Stock Program threshold levels. As a result, the HR Committee did not make any performance-based restricted stock grants in 2011 for the 2008-2010 performance period. P.B. Unit Program Grants in 2011 In 2011, the named executive officers Retention-based restricted stock is also an important For In March 2010, the HR Committee It is important to Table 7 — Performance Levels for the P.B. Restricted Stock Program Return on Equity (30% Weight) Net Income (30% Weight) Revenue from Acquisition or Organic Growth (25% Weight) Credit Rating(1) (15% Weight) Standard & Poor’s ratings are listed for reference purposes. The higher of Standard & Poor’s or Moody’s comparable rating on the last day of the performance period will be used to calculate the actual performance achievement level. The number of shares a named executive officer is granted is contingent upon achievement of levels, as follows: By achieving the threshold performance level for a performance goal, a named executive officer can earn 35% of the executive’s LTI compensation target for the performance-based component of the LTI grant based on the weighting for the performance goal. By achieving the target performance level for a performance goal, a named executive officer can earn 70% of the executive’s LTI compensation target for the performance-based component of the LTI grant based on the weighting for the performance goal. By exceeding the target performance level for a performance goal for awards in 2012 and 2013, a named executive officer can earn up to 150% and 200%, respectively, of the executive’s LTI compensation target for the performance-based component of the LTI grant. A named executive officer will not receive LTI unless the threshold performance goal is met or surpassed. The actual amount of performance-based LTI compensation awarded is proportionate to the performance achieved between threshold level and maximum level. For the 2010-2011 performance period, the Company had cumulative ROE of 11.8%, total net income of $209.6 million, total revenue from acquisitions and organic growth of $190.9 million and a credit rating of BB+. This results in a forecasted payout of 67.9% of maximum in 2012 under the P.B. Restricted Stock Program. The actual number of shares will be based on the one-year average stock price for the period ended March 31, 2012. These shares will vest in three equal annual installments beginning on May 15, 2013. P.B. Unit Program Performance Levels for Ongoing Performance Periods In January 2011, the HR Committee established cumulative EPS as the exclusive performance metric for the P.B. Unit Program for the performance period 2011-2013. The EPS goal was established in light of (i) improving, but still uncertain, economic conditions, (ii) the general expectation for a slow to moderate economic recovery over the next three years and the impact of this recovery on the Company’s businesses over such time frame, and (iii) the desire of the Company to focus its executives on improving earnings. The threshold level represents an achievable 8% annual increase in growth in earnings over 2010, the target level represents a considerable but reasonable 25% annual increase in earnings over 2010, and the maximum level represents an aggressive 50% annual increase in earnings over 2010. The HR Committee also took into consideration that the overlapping P.B. Restricted Stock Program, which is focused on growth, maintaining or improving the Company’s equity position, improving return on equity, and maintaining or improving the Company’s credit rating, could also pay out during 2012 and 2013. At its meetings throughout 2011, the HR Committee received regular updates on the performance of the Company with respect to the performance levels for the 2011 P.B. Unit Program. At the end of 2011, the HR Committee reviewed the progress to-date under the 2011 P.B. Unit Program and was pleased with the results. The HR Committee determined that continued focus on EPS growth was desirable and therefore again established EPS as the exclusive performance metric for the period 2012-2014. The threshold level represents an achievable 14% annual increase in growth in earnings over 2011, the target level represents a considerable but reasonable 22% annual increase in earnings over 2011 and the maximum level represents an aggressive 33% annual increase in earnings over 2011. The HR Committee also took into consideration that the overlapping P.B. Restricted Stock Program, which is focused on growth, maintaining or improving the Company’s equity position, improving return on equity, and maintaining or improving the Company’s credit rating, could also pay out during 2012 and 2013. It is important to note that performance goals are part of the Company’s incentive program and do not correspond to any financial guidance that the Company has provided to the investment community or that the Company will provide for future years and, therefore, should not be considered as statements of the Company’s expectations or estimates. Table 8— Performance Levels for Cumulative Measurement Period EPS Threshold EPS Target EPS Maximum 2011 - 2013 2012 - 2014 The Company’s retirement, savings, and deferred compensation plans are designed to provide some assurance that executives are financially prepared to transition from active employment. The HR Committee believes that these plans assist in recruiting and retaining senior executives. Each of the plans is discussed in the “Compensation of Executives” section of this proxy statement. The Company’s retirement, savings, deferred compensation, and Trinity Industries, Inc. Standard Pension Plan (the “Standard Pension Plan”) — a funded, tax qualified, non-contributory defined benefit pension plan that covers certain of the Company’s employees, including the named executive officers. Earnings are capped by the Internal Revenue Code (the “Code”) for those defined as “highly compensated employees.” On February 13, 2009, the Board amended the Standard Pension Pension Plan were determined and frozen as of that date. The amendment to the Standard Pension Plan Trinity Industries, Inc. Profit Sharing 401(k) Plan (the “401(k) Plan”) — a voluntary, tax qualified, defined contribution plan that covers most of the Company’s employees, including the named executive officers, and includes a potential annual Company match for a portion of each employee’s contribution. On February 13, 2009, the Board, in connection with its decision to freeze the Standard Pension Plan, amended the 401(k) Plan effective Trinity Industries, Inc. Supplemental Profit Sharing Plan (the “Supplemental Plan”) — a supplemental deferred profit sharing plan for highly compensated employees that allows them to defer a portion of their base pay and annual incentive and includes a Company match for a portion of their contribution. 2008 Deferred Compensation Plan and Agreement (the “Transition Compensation Plan”) — a plan designed to facilitate a smooth transition when the executive separates from service with the Company. The Transition Compensation Plan is an unfunded long-term plan whereby an amount equal to 10% of a participant’s salary and annual incentive compensation is set aside in an account on the books of the Company. The account is credited monthly with an interest rate equivalent as determined annually by the HR Committee (5% for 2011 and 2012). The account is payable to the participant in a lump sum or annual installments from one to 20 years, subject to compliance with the following conditions: The participant must give at least six months advance written notice of intent to For one year after separation from service, the participant must be available for consultation regarding the business and For one year after separation from service, the participant may not, directly or indirectly, become or serve as a participant, employee, owner or partner of any business which competes in Change in Control Agreements The Board of Directors has determined that it is appropriate to reinforce and encourage the continued attention and dedication of members of the Company’s management to their assigned duties without distraction in potential circumstances arising from the possibility of a change in control of the Company. Accordingly, the Company has entered into a change in control agreement with each of the named executive officers that provides for certain vesting upon a change in control and the payment of certain compensation if the named executive officer’s employment with the Company is terminated under one of the circumstances described in the agreement in connection with a change in control of the Company (as defined in the agreement). Health and Welfare Benefits The Company-supported medical plan, life insurance, and Internal Equity Regarding CEO Compensation Recoupment on Restatement The Board of Directors has adopted a Company policy that allows payouts to be recouped under annual and/or long-term incentive plans if the financial statements on which they are based are subsequently required to be restated as a result of errors, omissions, fraud, or other misconduct. The policy provides discretion to the HR Committee to make such determinations while providing a framework to guide their decisions. Stock Ownership Guidelines and Anti-Hedging Policy Stock ownership guidelines have been adopted that require the CEO to maintain ownership of Company Common Stock valued at five times base salary, the other named executive officers at three times base salary, and the Board of Directors at three times annual retainer. Stock ownership is defined as stock owned without restrictions; restricted shares that vest at retirement; shares or share equivalents held in a qualified or non-qualified profit sharing plan; shares or units granted on which restrictions remain; and equivalent shares determined from vested, in-the-money stock options. The named executive officers and the directors are all in compliance with the Company’s stock ownership requirements. The Company has also adopted a policy prohibiting the named executive officers, members of the Board of Directors, and other members of management from engaging in derivative transactions (including hedging) with respect to the Company’s Common Stock and other securities. Limitation on Deductibility of Executive Compensation For a The HR Committee believes the executive We have reviewed and discussed with management the Compensation Discussion and Analysis required by Item 402(b) ofRegulation S-K and based on such review and discussions, we recommended to the Board of Directors that the Compensation Discussion and Analysis be included in this proxy statement. Summary Compensation Table The following table and accompanying narrative disclosure should be read in conjunction with the Compensation Discussion and Analysis, which sets forth the objectives of the Company’s executive compensation The “Summary Compensation Table” below summarizes the total compensation paid or earned by each of the named executive officers for the fiscal years ended December 31, Name and Principal Position Salary ($)(1) Bonus ($)(2) Stock Awards ($)(3) Non-Equity Incentive Plan Compensation ($)(4) Change in Pension Value and Nonqualified Deferred Compensation Earnings ($)(5) All Other Compensation ($)(6) Total ($) Timothy R. Wallace James E. Perry D. Stephen Menzies William A. McWhirter S. Theis Rice For Messrs. Wallace, Perry, McWhirter, and Messrs. Perry and McWhirter each received a bonus in March 2011 of $50,000 in recognition of their added responsibilities and the quality of their job performance during the time they held their positions. Equity awards are the grant date fair value dollar amounts Non-equity incentive plan compensation represents cash awards earned (i) during This column represents both changes in pension value for the named executive officers, as well as above market earnings on deferred compensation. For Mr. Wallace Supplemental Retirement Plan, and $12,195 represents Mr. Wallace’s above market earnings on nonqualified deferred compensation under the Company’s Transition Compensation Plan. For 2011 for Messrs. Menzies, McWhirter, and Rice, the change in pension values was $18,000; $38,000; and $42,000, respectively, under the Standard Pension Plan and the above market earnings on nonqualified deferred compensation under the Transition Compensation Plan were $5,007; $4,133; and $1,169, respectively and $178 for Mr. Perry. For 2010 for Mr. Wallace, $731,000 of this column represents the aggregate change in pension values during 2010 fiscal year under the Standard Pension Plan and the Supplemental Retirement Plan, and The following table is a breakdown of all other compensation included in the “Summary Compensation Table” for the named executive officers: Executive Allowance (1) Perquisites and Other Personal Benefits (2) Company Contributions to Defined Contribution Plans(3) Transition Compensation Plan(4) Total All Other Compensation Timothy R. Wallace James E. Perry D. Stephen Menzies William A. McWhirter S. Theis Rice Represents the amounts payable pursuant to the Executive Amounts for Mr. Menzies Represents the Company’s matching amounts and the Additional Retirement Contribution under the Company’s 401(k) Plan for McWhirter Represents an amount equal to 10% of the salaries and annual incentive compensation set aside pursuant to the The participant must give at least six months advance written notice of intent to transition out of his or her position and must work with the Chief Executive Officer to develop and implement an agreed-on succession process to facilitate the smooth transition of the participant’s duties and responsibilities to his or her successor. For one year after separation from service, the participant must be available for consultation regarding the business and financial affairs of the Company, at the Company’s reasonable request and for mutually-agreed upon compensation. For one year after separation from service, the participant may not, directly or indirectly, become or serve as a participant, employee, owner or partner of any business which competes in a material manner with the Company, without prior written consent of the Chief Executive Officer or the Chairman of the HR Committee. The following table summarizes the Estimated Possible Payouts and Future Payouts Under Non-Equity Incentive Plan Awards(2) Estimated Future Payouts Under Equity Incentive Plan Awards All Other Stock Awards Number of Shares of Stock (#)(4) Grant Date Fair Value of Stock Awards ($)(5) Grant Date(1) Threshold ($) Target ($) Maximum ($) Threshold (#) Target(3) (#) Maximum (#) Timothy R. Wallace 2011 Annual Incentive Plan 2011 Equity Awards 2012 Annual Incentive Plan James E. Perry 2011 Annual Incentive Plan 2011 Equity Awards 2011 Equity Awards 2011 Equity Awards 2012 Annual Incentive Plan D. Stephen Menzies 2011 Annual Incentive Plan 2011 Equity Awards 2012 Annual Incentive Plan William A. McWhirter 2011 Annual Incentive Plan 2011 Equity Awards 2012 Annual Incentive Plan S. Theis Rice 2011 Annual Incentive Plan 2011 Equity Awards 2012 Annual Incentive Plan The grant date of all stock Represents the potential amounts payable in For The restricted stock granted in May The grant date fair value of the stock The stock The equity awards The performance-based restricted stock unit awards were made at the target amount for each named executive officer, based on the Company’s 2011 – 2013 financial performance target of $4.00 EPS. Recipients of the performance-based restricted stock units will not earn any such units unless the Company achieves threshold performance level of cumulative $3.00 EPS for the performance period. Recipients may earn the following percentages of the target grant amount: (i) 30% of the target grant for threshold performance ($3.00 cumulative EPS); (ii) 100% of the target grant for target performance ($4.00 cumulative EPS); and (iii) 200% of the target grant for maximum performance ($6.00 cumulative EPS). For performance falling between the specified levels, the amount of units earned will be interpolated accordingly. During the performance period, recipients do not earn dividends on, and are not entitled to vote with respect to, the performance-based restricted stock units. Each performance-based restricted stock unit earned will convert into one share of Common Stock and vest on May 15, 2014. In the event of death or disability occurring prior to the third anniversary of the date of grant, the performance metrics will be assumed to have been met at target, with the actual number of shares to be awarded determined by multiplying the target grant by a fraction, the numerator of which is the number of days since the date of grant to the date of death or disability and the denominator of which is the number of days in The retention-based restricted stock awarded in May 2011 vests on May 15, 2016. The award of retention-based restricted stock made to Mr. Perry in March 2011 vests at age 65. The award of retention-based restricted stock made to Mr. Perry in December 2011 vests in three equal annual installments beginning The non-equity incentive plan awards for The estimates for future payouts under the The Company has an Executive Perquisite The change in pension value for Mr. Wallace is primarily a result of Base salary, the The following table summarizes as of December 31, Outstanding Equity Awards at Fiscal Year-End Table Number of Securities Underlying Unexercised Options (#) Number of Securities Underlying Unexercised Options (#) Option Exercise Price ($) Option Expiration Date Number of Shares or Units of Stock That Have Not Vested (#)(2) Market Value of Shares or Units of Stock That Have Not Vested ($) Equity Incentive Plan Awards: Number of Unearned Shares, Units or Other Rights That Have Not Vested (#) Equity Incentive Plan Awards: Market or Payout Value of Unearned Shares, Units or Other Rights That Have Not Vested ($) Timothy R. Wallace James E. Perry D. Stephen Menzies William A. McWhirter S. Theis Rice All unvested stock The following table provides the vesting date of unvested stock awards. Timothy R. Wallace James E. Perry D. Stephen Menzies William A. McWhirter S. Theis Rice 05/11/12 05/15/12 05/09/13 05/15/13 05/15/14 05/15/15 05/15/16 05/15/17 05/15/19 05/15/24 Retirement(a) Age 65(b) The earlier of age 65 or rule of 80(c) Grants of restricted stock which will vest upon the earlier of: (i) retirement; (ii) death, disability or change in control; or (iii) consent of the HR Committee after three years from the date of grant. Grant of restricted stock which will vest upon the earlier of: (i) when the executive officer reaches age 65; (ii) death, disability or change in control; or (iii) consent of the HR Committee after three years from the date of grant. Grant of restricted stock which will vest upon the earlier of: (i) when the executive officer reaches age 65; (ii) the executive officer’s age plus years of vested service equal 80; (iii) Represents the Represents the Represents the target number or value, as applicable, of performance-based restricted stock units that could be earned if target financial performance goals are achieved. The actual number of shares to be issued in 2014 will be based on the Company’s aggregate EPS from 2011 through 2013. See “Discussion Regarding Summary Compensation Table and Grants of Plan-Based Awards Table” and “Compensation Discussion and Analysis – Long Term Incentive Compensation Programs.” The following table summarizes for the named executive officers in Option Exercises and Stock Vested Table Number of Shares Acquired on Exercise (#) Value Realized on Exercise ($) Number of Shares Acquired on Vesting (#) Value Realized on Vesting ($) Timothy R. Wallace James E. Perry D. Stephen Menzies William A. McWhirter S. Theis Rice The following table summarizes the present value of the accumulated pension benefits of the named executive officers under the Standard Pension Plan and for Mr. Wallace the Supplemental Retirement Plan. Pension Benefits Table Number of Years Credited Service (#) Present Value of Accumulated Benefit ($)(1) Payments During Last Fiscal Year ($) Timothy R. Wallace James E. Perry D. Stephen Menzies William A. McWhirter S. Theis Rice The present value of the accumulated benefit is calculated in accordance with The Standard Pension Plan is a noncontributory defined benefit retirement and death benefit plan. Funds are contributed periodically to a trust that invests the Company’s contributions and earnings thereon in order to pay the benefits to the participating employees. The plan provides for the payment of monthly retirement benefits determined under a calculation based on credited years of service and a participant’s highest compensation over five consecutive years in the last ten years of employment. Retirement benefits are paid to participants upon normal retirement at the age of 65 or later, or upon early retirement. Mr. Wallace turned 55 on December 30, 2008, and, as a result, met the definition of “early retirement” on December 31, 2008. Mr. Wallace has not provided notice of intention to take early retirement. Covered compensation includes salary and non-equity incentive plan compensation as shown in the “Summary Compensation Table.” Other elements of compensation in the “Summary monthly compensation up to $800 plus 1% of average monthly compensation over $800 times the years of credited service. The plan also provides for the payment of a death benefit before retirement that is the greater of the lump sum value of the accrued benefit under the pension plan or one times base pay with less than 10 years of service and 21/2 times base pay with more than 10 years of service. The Company has a Supplemental Retirement Plan that applies to Mr. Wallace. The Supplemental Retirement Plan provides that the amount of the annual retirement benefit under The table below shows the contributions by the executives and the Company, the aggregate earnings on nonqualified deferred compensation in Nonqualified Deferred Compensation Table Executive Contributions in Last Fiscal Year(1) Registrant Contributions in Last Fiscal Year(2) Aggregate Earnings in Last Fiscal Year(3) Aggregate Balance at Last Fiscal Year End(4) Timothy R. Wallace James E. Perry D. Stephen Menzies William A. McWhirter S. Theis Rice Salary and incentive compensation deferrals to the Company’s Supplemental Plan. The amounts are also included in the “Summary Compensation Table” for Includes an amount equal to This column represents This column includes amounts in the “Summary Compensation Table” for (i) an amount equal to ten percent of the salaries and incentive compensation set aside pursuant to the (ii) matching amounts under the Company’s Supplemental The Supplemental Plan was established for highly compensated employees who are limited as to the amount of deferrals allowed under the Company’s 401(k) plan. There is no limit on the percentage of salary or incentive pay that an executive may elect to defer into the Supplemental Plan. Participants must elect to defer salary prior to the beginning of the fiscal year and annual incentive pay prior to the beginning of the year to which the incentive payments relate. The first 6% of a participant’s base salary and bonus contributed to the Supplemental Plan, less any compensation matched under the 401(k) plan, may be matched from 25% to 50% by the Company based on years of service. The Company’s match vests 20% for each year of service up to 100% after five years. Participants may choose from several mutual If elected at the time of enrollment, participants may take an in-service distribution of deferrals three years after the end of the plan year in which the deferral was made. Amounts are paid out immediately on death or disability. Upon termination of employment, amounts in the Supplemental Plan are paid out beginning Each named executive officer participates in the The participant must give at least six months advance written notice of intent to transition out of his or her position and must work with the Chief Executive Officer to develop and implement an agreed-on succession process to facilitate the smooth transition of the participant’s duties and responsibilities to his or her successor. For one year after separation from service, the participant must be available for consultation regarding the business and financial affairs of the Company, at the Company’s reasonable request and for mutually-agreed upon compensation. For one year after separation from service, the participant may not, directly or indirectly, become or serve as a participant, employee, owner or partner of any business which competes in a material manner with the Company, without prior written consent of the Chief Executive Officer or the Chairman of the HR Committee. On February 13, 2009, the Board amended the 401(k) Plan to allow the participants in the Standard Pension Plan to participate in the enhanced portion of the 401(k) Plan. This amendment is discussed in the Compensation Discussion and Analysis section under “Post-employment Benefits.” Named executive officers that terminate voluntarily, involuntarily, by death or by disability have the same death and disability benefits that are available to the majority of salaried employees. While employed by service. Stock options and restricted stock held by the named executive officers have no acceleration of vesting upon voluntary or involuntary termination but vesting is accelerated on death, disability, and in some cases retirement. Pursuant to the terms of the Executive Severance Agreement described below, stock options, restricted stock, and benefits under the Supplemental Plan, Timothy R. Wallace James E. Perry D. Stephen Menzies William A. McWhirter S. Theis Rice Death Restricted Stock Total Disability Restricted Stock Total Retirement Restricted Stock Total Change in Control Restricted Stock Annual Incentive Compensation Total Each of the named executive officers has entered into an Executive Severance Agreement (the “Agreement”) with the Company. In addition to the acceleration of vesting upon a change in control as described above, the Agreement provides for compensation if the named executive officer’s employment is terminated under one of the circumstances described in the Agreement in connection with a “change in control” of the Company. A “change in control” is generally defined as (i) any other person or entity acquires beneficial ownership of 30% or more of The Agreements are for continuous two-year terms until terminated by the Company upon specified notice and continue for two years following a change in control. The Agreements provide that if there is a change in control of the Company and if the Company terminates the executive’s employment other than as a result of the executive’s death, disability or retirement, or for “cause,” or if the executive terminates his or her employment for “good reason,” then the Company will pay to such executive a lump sum equal to three times (i) the amount of the executive’s base salary, (ii) the annual perquisite allowance, and (iii) the higher of the average bonus earned over the previous three years or the target bonus for the fiscal year in which the change in control occurs. “Cause” is generally defined as a participant’s (i) willful and continued failure to substantially perform his employment duties with the Company; (ii) misappropriation or embezzlement from the Company or any other act or acts of dishonesty by the participant constituting a felony that results in gain to the participant at the Company’s “Good reason” is generally defined as, following a change in control, (i) a material adverse change in a participant’s working conditions or responsibilities; (ii) assignment to the participant of duties inconsistent with the participant’s position, duties, and reporting responsibilities; (iii) a change in the participant’s titles or offices; (iv) a reduction in the participant’s annual base salary; (v) a material reduction in the participant’s benefits, in the aggregate, under the benefits plans, incentive plans, and securities plans; (vi) failure to provide a participant with the number of paid vacation days entitled at the time of a change in control; (vii) any material breach by the Company of the Agreement; (viii) any successor or assign of the Company fails to assume the Agreement; (ix) the relocation of the participant’s principal place of employment outside of Dallas County, Texas; (x) voluntary resignation by the participant, or termination of employment by reason of the participant’s death or disability, at any time during either a90-day period beginning after a change in control or the30-day period beginning on the 365th day after a change in control; or (xi) any purported termination not conducted pursuant to a notice of termination by the Company. The severance benefits provided by the Agreements also include continuation of all medical, dental, vision, health, and life insurance benefits to which each executive would have been entitled if the executive had continued in the employment of the Company for 36 months after the executive’s termination and a lump sum equivalent to the amount of income tax payable due to the continuation of insurance The Agreements further provide that if any payment to which the executive is entitled would be subject to the excise tax imposed by Section 4999 of the Code, then the Company will pay to the executive an additional amount so that the net amount retained by the executive is equal to the amount that otherwise would be payable to the executive if no such excise tax has been imposed. If each named executive officer’s employment had been terminated on December 31, Compensation(1) Timothy R. Wallace James E. Perry D. Stephen Menzies William A. McWhirter S. Theis Rice Cash lump sum equal to three times base salary, perquisite allowance, and applicable bonus. Estimated cost of continuation for 36 months of medical and life insurance benefits. Estimated gross up of income, employment, and change in control excise taxes. The calculations for Director Compensation Table Fees Earned or Paid in Cash ($)(1) Stock Awards ($)(2)(3) Change in Pension Value and Nonqualified Deferred Compensation Earnings ($)(4) All Other Compensation ($)(5) Total ($) John L. Adams Rhys J. Best David W. Biegler Leldon E. Echols Ronald J. Gafford Ronald W. Haddock Jess T. Hay Adrian Lajous Charles W. Matthews Diana S. Natalicio Douglas L. Rock Includes amounts deferred under the 2005 Deferred Plan for Director Fees. Stock awards are for restricted stock units awarded in As of December 31, 2011, the Includes for Messrs. Adams and Biegler the above market earnings from the interest rate equivalent under the 2005 Deferred Plan for Director Fees. Includes dividend equivalents on stock units in director fee deferral plans. For 2011 Compensation Each director of the Company who is not a compensated officer or employee of the Company Board member — annual retainer of $50,000 Presiding Director — annual retainer of $5,000 Board meeting fee of $2,000 for each meeting attended Audit Committee Chairman — annual retainer of $15,000 Member of the Audit Committee — $2,000 for each meeting attended Human Resources Committee Chairman — annual retainer of $7,500 Chairman of other Board Committees — annual retainer of $5,000 Member of other Board Committees — $1,500 for each meeting attended In addition, the Company The Board has also established a cash equivalent value as a guide for annual equity compensation for directors of $100,000 and will use a 12 month average share price as the basis for future awards. Non-employee directors may elect, pursuant to Fees deferred pursuant to the Director Deferred Plan are credited to the director’s account monthly. Fees that are not deferred pursuant to the Director Deferred Plan are paid in cash quarterly, in arrears. 2012 Compensation In December 2011, the Board amended certain aspects of its director compensation plan. For 2012, each director of the Company who is not a compensated officer or employee of the Company will receive cash compensation as follows: Board member — annual retainer of $60,000 Presiding Director — annual retainer of $15,000 Board meeting fee of $2,000 for each meeting attended Members of Committees — $2,000 for each meeting attended Audit Committee Chair — annual retainer of $15,000 Chairs of the Human Resources Committee and Finance and Risk Committees — annual retainer of $10,000 Chair of Corporate Governance and Directors Nominating Committee — annual retainer of $5,000 The annual equity compensation grant will be $120,000 and will continue to use a 12 month average price as the basis for awards. In addition, the Company will continue to pay directors a fee equal to $2,000 per day for ad hoc or special assignment work performed for or at the request of the Chairman, Chief Executive Officer, and President. Prior to the December 2011 adjustments, director compensation had not been increased since 2008. The the benefits to the Company of the Related Person Transaction; the impact of a director’s independence if the related person is a director, an immediate family member of a director or an entity in which a director is a partner, stockholder or executive officer; the availability of other sources for comparable products and services; the terms of the transaction; and the terms available to unrelated third parties or employees generally. After reviewing such information, the Under the policy, the HR Committee must approve hiring of immediate family members of executive officers or directors and any subsequent material changes in employment or compensation. Employed family members of directors and executive officers with total compensation for Mr. Patrick S. Wallace, brother of Timothy R. Wallace, is an officer of a subsidiary of the Company. His total compensation was $1,178,193 for 2011, which includes base salary; bonus; matching contributions to defined contribution plans; perquisite allowance; and the aggregate grant date fair value of all equity awards pursuant to ASC 718. The following table presents the beneficial ownership of Amount and Nature of Ownership of Common Stock(1) Percent of Class Directors: John L. Adams Rhys J. Best David W. Biegler Leldon E. Echols Ronald J. Gafford Ronald Haddock Adrian Lajous Melendy E. Lovett Charles W. Matthews Diana S. Natalicio Douglas L. Rock Named Executive Officers: Timothy R. Wallace James E. Perry D. Stephen Menzies William A. McWhirter S. Theis Rice All Directors and Executive Officers as a Group (18 persons): Other 5% Owners: Lord Abbett & Co. LLC First Pacific Advisors, LLC The Bank of New York Mellon Corporation BlackRock, Inc. Piper Jaffray Companies Franklin Resources, Inc. Dimensional Fund Advisors LP Less than one percent (1%) Unless otherwise noted, all shares are owned directly, and the owner has the right to vote the shares, except for shares that officers and directors have the right to acquire through the exercise of stock options or through restricted stock units held as of March 20,021; Best Lord, Abbett & Co. LLC and its affiliates, 90 Hudson Street, Jersey City, NJ 07302, reported to the SEC on an Amendment to Schedule 13G filed February 14, 2012, that Lord, Abbett & Co. LLC, in its capacity as investment adviser to its various clients, may be deemed to be the beneficial owner of 6,022,929 shares First Pacific Advisors, LLC and its affiliates, 11400 West Olympic Boulevard, Suite 1200, Los Angeles, The Bank of New York Mellon Corporation, One Wall Street, 31st Floor, New York, NY 10286, reported to the SEC on a Schedule 13G filed January 30, 2012, that The Bank of New York Mellon Corporation and its subsidiaries, in their various fiduciary capacities, had beneficial ownership of 4,316,238 shares. The Bank of New York Mellon Corporation also stated that it and its subsidiaries had sole voting power over 3,279,299 shares, sole dispositive power over 4,285,825 shares, and shared dispositive power over 2,990 shares. BlackRock, Inc. and its affiliates, 40 East 52nd Street, New York, NY 10022, reported to the SEC on an Amendment to Schedule 13G filed February 8, 2012, that they have sole voting and dispositive power over 4,305,597 shares. Piper Jaffray Companies, 800 Nicollet Mall Suite 800, Minneapolis, MN 55402, reported to the SEC on an Amendment to Schedule 13G filed February 14, 2012, that it may be deemed to be the beneficial owner of 4,294,260 shares through its control of its wholly-owned subsidiary, Advisory Research, Inc. Piper Jaffray Companies also stated that Advisory Research, Inc. has sole voting and dispositive power over all 4,294,260 shares. Franklin Resources, Inc. and its affiliates, One Franklin Parkway, San Mateo, Dimensional Fund Advisors LP and its affiliates, Palisades West, Building One, 6300 Bee Cave Road, Austin, TX, 78746, reported to the SEC on an Amendment to Schedule 13G filed Dimensional Fund Advisors LP, in its capacity as investment adviser, sub-adviser, and/or investment manager to its various clients, may be deemed to be the beneficial owner of 4,102,723 shares owned by such clients. Dimensional Fund Advisors LP also stated that it and its affiliates had sole voting power over Section 16(a) of the Securities Exchange Act of 1934, as amended, requires the Company’s executive officers, directors, and persons who own more than ten percent of the Company’s Common Stock to file initial reports of ownership and changes in ownership with the Additionally, SEC regulations require that the Company identify any individuals for whom one of the referenced reports was not filed on a timely basis during the most recent fiscal year. To the Company’s knowledge, based on a review of reports furnished to it and written representations from reporting persons, each individual who was required to file such reports complied with the applicable filing requirements during Stockholders’ proposals to be presented at the Under the Bylaws of the Company, certain procedures are provided which a stockholder must follow in order to place in nomination persons for election as directors at an annual meeting of stockholders or to introduce an item of business at an annual meeting of stockholders. These procedures provide, generally, that stockholders desiring to place in nomination persons for directors,and/or bring a proper subject of business before an annual meeting, must do so by a written notice timely received (on or before March The Chairman of the meeting may refuse to allow the transaction of any business not presented, or to acknowledge the nomination of any person not made, in compliance with the foregoing procedures. Copies of the Company’s Bylaws are available from the Secretary of the Company. See “Corporate Governance and Directors Nominating Committee” for the process for stockholders to follow to suggest a director candidate to the The Company’s Annual Report onForm 10-K for the fiscal year ended December 31, Management of the Company is not aware of other business to be presented for action at the Annual Meeting; however, if other matters are presented for action, it is the intention of the persons named in the accompanying form of proxy to vote in accordance with their judgment on such matters. JARED S. RICHARDSON Associate General Counsel and Secretary March 30, 2012 TRINITY INDUSTRIES, INC. 2525 STEMMONS FREEWAY DALLAS, TX 75207 VOTE BY INTERNET Use the Internet to transmit your voting instructions and Electronic Delivery of Future PROXY MATERIALS If you would like to reduce the costs incurred by our company in mailing proxy materials, you can consent to receiving all future proxy statements, proxy cards and annual reports electronically via e-mail or the Internet. To sign up for electronic delivery, please follow the instructions above to vote using the Internet and, when prompted, indicate that you agree to receive or access proxy materials electronically in future years. VOTE BY PHONE - 1-800-690-6903 Use any touch-tone telephone to transmit your voting instructions up until 11:59 P.M. Eastern Time the day before the cut-off date or meeting date. Have your proxy card VOTE BY MAIL Mark, sign and Withhold All For All Except 1. Election of Nominees 01 John L. Adams 02 Rhys J. Best 03 David W. Biegler 04 Leldon E. Echols 05 Ronald J. Gafford 06 Ronald W. Haddock 07 Adrian Lajous 08 Melendy E. Lovett 09 Charles W. Matthews 10 Douglas L. Rock 11 Timothy R. Wallace 2 Advisory vote to approve named executive officer compensation. 3 To approve Important Notice Regarding the Availability of Proxy Materials for the Annual Meeting:The Notice & Proxy Statement, Annual Report is/are available atwww.proxyvote.com. TRINITY INDUSTRIES, INC. THIS PROXY IS SOLICITED BY THE BOARD OF DIRECTORS ANNUAL MEETING OF STOCKHOLDERS As an alternative to completing this form, you may enter your vote instruction by telephone at The undersigned hereby appoints Timothy R. Wallace, This proxy, when properly executed, will be voted in the manner directed herein. If no such direction is made, this proxy will be voted in accordance with the Board of Directors’ recommendations.Independence of DirectorsPursuant(the “NYSE”(“NYSE”) listing standards and the rules and regulations promulgated by the Securities and Exchange Commission (“SEC”). In addition, the Board of Directors has adopted a formal set of Categorical Standards of Director Independenceestablished certain guidelines to assist it in making its determination with respect toany such determinations regarding director independence under the NYSE listing standards. The Categorical Standards(the “Independence Guidelines”), which are available on ourthe Company’s website atwww.trin.netunder the heading “Investor Relations/Governance” or in print upon written request to the Corporate Secretary.Relations-Governance-Categorical Standards of Director Independence.” The Categorical StandardsIndependence Guidelines set forth commercial and charitable relationships that willmay not be consideredrise to bethe level of material relationships that would impair a director’s independence. independence as set forth in the NYSE listing standards and SEC rules and regulations. The actual determination of whether such relationships as described in the Independence Guidelines actually impair a director’s independence is made by the Board on a case-by-case basis.Categorical Standards.NYSE listing standards and SEC rules and regulations together with the Independence Guidelines. In addition to applyingmaking such determinations, the Categorical Standards, the Board,ourthe Company’s subsidiaries and subsidiaries of Austin Industries, Inc. (“Austin Industries”) for which Mr. Ronald J. Gafford serves as President and Chief Executive Officer, and (ii) between the Company’s subsidiaries and Southcross Energy, LLC (“Southcross”), for which Mr. David W. Biegler serves as Chairman and Chief Executive Officer. Thesewhich totaled $1,239,548 in 2008with Austin Industries involved billings to Austin Industries by the Company of approximately $2,603,000, and constitutedinvoices to the Company from Austin Industries of approximately $3,700. The transactions involved amounts constituting less than 2% of the consolidated gross revenues of each of Austin Industries Inc.and the Company in 2008,2011, were made in the ordinary course of business in arms-length transactions, and substantially all were determined by competitive bids. The transactions involved the purchase by Austin Industries Inc. or its subsidiaries from ourthe Company’s subsidiaries of concrete, and highway products, and steel highway bridge girders.the purchase by subsidiaries of the Company of demolished concrete from Austin Industries. Mr. Gafford did not have a direct pecuniaryfinancial interest in any of the transactions. The Board also considered thattransactions with Austin Industries.son-in-law Company and Southcross entered into a transaction involving the purchase by Southcross from the subsidiary of Mr. Hay is employed bystorage tanks for approximately $1,400,000. This transaction involved an amount constituting less than 2% of the consolidated gross revenues of each of Southcross and the Company in 2011, was made in the ordinary course of business in arms-length transactions, and was the result of a non-executive officer capacity. competitive bid process. Mr. Biegler did not have a direct financial interest in this transaction.Categorical Standards and the listing standards of the NYSE:NYSE and the SEC rules and regulations: John L. Adams, Rhys J. Best, David W. Biegler, Leldon E. Echols, Ronald J. Gafford, Ronald W. Haddock, Jess T. Hay, Adrian Lajous, andMelendy E. Lovett, Charles W. Matthews, Diana S. Natalicio;Natalicio, and Douglas L. Rock; and that Timothy R. Wallace is not independent because of his employment as Chairman, Chief Executive Officer, and President of the Company;Company. Dr. Natalicio has reached the mandatory retirement age and is therefore not standing for re-election.John L. Adamsthe decision as to whether the offices of Chairman and Chief Executive Officer should be combined or separated is the responsibility of the Board. The members of the Board possess experience and unique knowledge of the challenges and opportunities the Company faces. They are, therefore, in the best position to evaluate the current and future needs of the Company and to judge how the capabilities of the directors and senior managers can be most effectively organized to meet those needs. Given his deep knowledge of the Company and experience in leading it through a range of business environments, the Board believes that the most effective leadership structure for the Company is to have Mr. Wallace serve as both Chairman and Chief Executive Officer.becausedirectors;his previous employmentactions and/or suggestions taken or made during executive sessions;Company withinChairman and Chief Executive Officer regarding the three years preceding this proxy statement.quality, quantity, and timeliness of information to be furnished from time to time to the members of the Board;2
In those instances where an ongoing dialog between the stockholders and the non-management directors is appropriate, serve as a conduit for communications between the stockholders and the non-management directors; andPerform such other duties as the Board from time to time may assign.Board CommitteesHuman Resources Committee, Corporate Governance and Directors Nominating Committee, and Finance and Risk ManagementCommittee, and Human Resources Committee. Each of the committees is governed by a charter, a current copy of which is available on ourthe Company’s website atwww.trin.netunder the heading “Investor Relations/Governance.Relations-Governance.” A copy of each charter is also available in print to stockholders upon written request to the Corporate Secretary. Mr. Wallace, Chairman, Chief Executive Officer, and President of the Company, does not serve on any Board committee. Since Ms. Lovett recently joined the Board of Directors, she does not currently serve on any committees. It is currently anticipated that she will be added to the Audit Committee and the Human Resources Committee. Director membership of the committees is identified below.Director
Resources* * * * * * * * * * * * * * * * * * * * * * * * * CorporateGovernance &DirectorsFinance &AuditHuman ResourcesNominatingRisk ManagementDirectorCommitteeCommitteeCommitteeCommitteeJohn L. Adams*Rhys J. Best****David W. Biegler****Leldon E. Echols**Ronald J. Gafford**Ronald W. Haddock***Jess T. Hay****Adrian Lajous * * Diana S. Natalicio** ** and the Company’s procedures for monitoring compliance with its Code of Business Conduct and Ethics.Ethics; and the Company’s policies and procedures with respect to risk assessment, management, and mitigation. In carrying out its function, the Audit Committee (i) reviews with management, the chief audit executive, and the independent auditors the Company’s financial statements, the accounting principles applied in their preparation, the scope of the audit, any comments made by the independent auditors upon the financial condition of the Company and its accounting controls and procedures; (ii) reviews with management its processes and policies related to risk assessment, management, and mitigation, compliance with corporate policies, compliance programs, internal controls, corporate aircraft usage, summaries of officermanagement’s travel and entertainment reports; and (iii) performs such other matters as the Audit Committee deems appropriate. The Audit Committee also pre-approves all auditing and all allowable non-audit services provided to the Company by the independent auditors. The Audit Committee selects and retains the independent auditors for the Company, subject to stockholder ratification, and approves audit fees. The Audit Committee met seven times during 2008.2011. The Board of Directors has determined that all members of the Audit Committee are “independent” as defined by the rules of the SEC and the listing standards of the NYSE. The Board has determined that Mr. Biegler,Echols, Chair of the Audit Committee, Mr. Best,Biegler, Mr. Echols,Haddock, and Mr. HaddockRock are each qualified as an audit committee financial expert within the meaning of SEC regulations.3Finance and Risk Management CommitteeThe duties of the Finance and Risk Management Committee generally are to periodically review the financial status of the Company; review the Company’s compliance with certain debt instruments that may exist; make recommendations to the Board regarding financings and authorize financings within limits prescribed by the Board; review and assess risk exposure related to the Company’s operations; monitor the funds for the Company’s benefit plans; and review significant acquisitions and dispositions of businesses or assets and authorize such transactions within limits prescribed by the Board. Each of the members of the Finance and Risk Management Committee, except Mr. Adams, is an independent director under the NYSE listing standards. The Committee met five times during 2008.Corporate Governance and Directors Nominating CommitteeCorporate Governance and Directors Nominating Committee is an independent director under the NYSE listing standards. The Corporate Governance and Directors Nominating Committee met three times during 2008.2011. Corporate Governance and Directors Nominating Committee utilizes independent compensation consultants from time to time to assist in making its recommendations to the Board. In 2007, the Company’s Vice President, Human Resources and Shared Services (the “VP of Human Resources”), in consultation with the Chairman of the Corporate Governance and DirectorsThe Nominating Committee prepared a director compensation review of several relevant director compensation studies and a peer group of comparably sized companies. After a review of this report, the Corporate Governance and Directors Nominating Committee recommended, and the Board approved, maintaining the 2007 compensation in 2008. In mid-2008, the Corporate Governance and Directors Nominating Committee retained the services of Hewitt Consulting, a nationally-recognized compensation consulting firm, to provide a comparator group study of Board compensation. After a review of this consultant’s report, the Corporate Governance and Directors Nominating Committee recommended, and the Board approved, revisingreviewed the director compensation effective September 7, 2008 to increase the Board meeting fee to $2,000 per meetingfor 2011 and to pay each director a fee equal to $2,000 per day for ad hoc or special assignment work performed for and at the request of the Chairman, Chief Executive Officer, and President.recommended certain changes, as outlined in “Director Compensation.” Corporate Governance and Directors Nominating Committee will consider director candidates recommended to it by stockholders. In considering candidates submitted by stockholders, the Corporate Governance and Directors Nominating Committee will take into consideration the needs of the Board and the qualifications of the candidate. To have a candidate considered by the Corporate Governance and Directors Nominating Committee, a stockholder must submit the recommendation in writing and must include the following information:• • The name, age, business, and residence addresses of the candidate, the candidate’s resume or a listing of his or her qualifications to be a director of the Company, and the person’s consent to be a director if selected by4the Corporate Governance and Directors Nominating Committee, nominated by the Board, and elected by the stockholders.The stockholder recommendation and information described above must be sent to the Corporate Secretary at 2525 Stemmons Freeway, Dallas, Texas 75207 and must be received by the Corporate Secretary not less than 120 days prior to the anniversary date of the date the Company’s proxy statement was released in connection with the previous year’s Annual Meeting of Stockholders. Corporate Governance and Directors Nominating Committee believes that the minimum qualifications for serving as a director of the Company are that a nominee demonstrate depth of experience at the policy makingpolicy-making level in business, government or education, possess the ability to make a meaningful contribution to the Board’s oversight of the business and affairs of the Company and a willingness to exercise independent judgment, and have an impeccable reputation for honest and ethical conduct in both his or her professional and personal activities. In addition, the Corporate Governance and Directors Nominating Committee examines a candidate’s time availability, the candidate’s ability to make analytical and probing inquiries, and financial independence to ensure he or she will not be financially dependent on director compensation. Corporate Governance and Directors Nominating Committee identifies potential nominees by asking, from time to time, current directors and executive officers for their recommendation of persons meeting the criteria described above who might be available to serve on the Board. The Corporate Governance and Directors Nominating Committee also may engage firms that specialize in identifying director candidates. As described above, the Corporate Governance and Directors Nominating Committee will also consider candidates recommended by stockholders.Corporate Governance and Directors Nominating Committee as a potential candidate, the Corporate Governance and Directors Nominating Committee makes an initial determination regarding the need for additional Board members to fill vacancies or expand the size of the Board. If the Corporate Governance and Directors Nominating Committee determines that additional consideration is warranted, the Corporate Governance and Directors Nominating Committee will review such information and conduct interviews as it deems necessary in order to fully evaluate each director candidate. In addition to the qualifications of a candidate, the Corporate Governance and Directors Nominating Committee will consider such relevant factors as it deems appropriate, including the current composition of the Board, the evaluations of other prospective nominees, and the need for any required expertise on the Board or one of its committees. The Corporate Governance and Directors Nominating Committee also seeks forcontemplates multiple dynamics that promote and advance diversity among its members. Although the Board to be balanced as to itsNominating Committee does not have a formal diversity experience,policy, the Nominating Committee considers a number of factors regarding diversity of personal and professional backgrounds (both domestic and international), national origins, specialized skills and expertise.acumen, and breadth of experience in industry, manufacturing, financing transactions, and business combinations. The Corporate Governance and Directors Nominating Committee’s evaluation process will not vary based on whether or not a candidate is recommended by a stockholder.assistsmakes recommendations to the Board of Directors in their fiduciaryits responsibilities relating to the fair and competitive compensation of the Company’s ChiefOfficer and other senior executives.Officer. The HR Committee also discusseshas been delegated authority by the Board of Directors to make compensation decisions with respect to the other named executive officers (as defined below). Each of the members of the HR Committee is an independent director under the NYSE listing standards. The HR Committee met five times during 2011.administers and makes or recommendsapproves awards under the Company’s incentive compensation and equity based plans. The HR Committee annually evaluates the leadership and performance of Mr. Wallace, ourthe Company’s Chairman, Chief Executive Officer, and President (collectively referred to as the “CEO”). The CEO also provides to the HR Committee his assessment of the performance of his direct reports. The HR Committee also has access to the Company’s key leaders. For 2008, the members of the HR Committee were Messrs. Haddock, Echols, Gafford and Hay and Dr. Natalicio. Each of these members of the HR Committee is an independent director under the NYSE listing standards. The HR Committee met five times during 2008.The HR Committee annually recommends to the Company’s independent directors the total compensation for the CEO. The independent directors are responsible for approving the CEO’s compensation. The CEO provides to the HR Committee his assessment of the performance of his direct reports. The HR Committee also has access to the Company’s key leaders. The HR Committee reviews and approves compensation for the Chief Financial Officer (the “CFO”) and the other executive officers named in the “Summary Compensation Table.” The CEO, the CFO, and the other executive officers named in the “Summary Compensation Table” are referred to in this proxy statement as the “named executive officers.”5The Role of the Compensation Consultantprogramprograms and to perform fourfive key tasks. The consultants (i) review and assist management in the design of the Company’s compensation program. Theyprograms, (ii) provide insight into compensation best practices used by other companies. Theycompanies, (iii) benchmark the Company’s compensation pay levels with relevant industry surveys, (iv) provide proxy disclosure information for comparator companies, and relevant industry surveys. And, they(v) provide input to the HR Committee on the structure and overall competitiveness of the Company’s compensation programs. The HR Committee has found significant benefit from using independent consultants, and as a result, the Company has been able to use best practices and maintain competitive compensation programs.Longnecker and Associates (referred to in this proxy statement as “L&A”Meridian Compensation Partners, LLC (the “Compensation Consultant”), a regionally-recognized compensation consultant firm, as its compensation consultant to assist in providing an independent assessment of the executive compensation program. L&Aprograms. Meridian Compensation Partners, LLC was the HR Committee’s sole compensation consultant in 2011. The Compensation Consultant reported directly to the HR Committee for the purposes of advising it on matters relating to 2007 and 20082011 compensation. The services of L&Athe Compensation Consultant were used only in conjunction with executive compensation matters. L&AThe Compensation Consultant was not retained by the Company for any other purpose.L&Athe Compensation Consultant to provide analyses, insight, and benchmarking information for 20082011 on the 25 highest compensatednamed executive officers and other key executives to determine whether the compensation packages for these executives were competitive with the market and met the objective of the Company to attract, hire,motivate, and retain the best talent. L&AThe Compensation Consultant was instructed to:• review the total direct compensation (base salary, annual incentive, and long term incentive);• confirm that the comparator companies selected by the HR Committee were appropriate for competitive benchmarking; and• gather publicly traded comparator company proxy statements to ascertain market competitive rates specifically for the named executive officers.L&A was instructed to benchmarkascertain market competitive rates specifically for the named executive officers.2008 as well as to calculate a market median2011, excluding the Executive Perquisite Allowance, and determined the 25th percentile, 50th percentile (market median), and the 75th percentile for each position, develop a compensation range using the market median and 75th percentile, and present their findings to the HR Committee.The HR Committee retained the services of Hewitt Consulting (referred to in this proxy statement as “Hewitt”), a nationally-recognized compensation consulting firm, replacing L&A, as its compensation consultant with respect to the executive compensation program beginning in March 2008. Hewitt provided consulting services on programs such as change in control and was instructed to benchmark all components of executive compensation for 2009 as well as to calculate a market median for each position, develop a compensation range using the market median and 75th percentile, and present their findings to the HR Committee.position.VPSenior Vice President of Human Resources work with the HR Committee and the compensation consultantCompensation Consultant to develop the framework and design the plans for each of the components of compensation.all compensation components. The CEO and CFO recommend the financial performance measurements for the annual incentive awards and the long term performance-based restricted stock awards, subject to HR Committee approval for all named executive officers, except Mr. Wallace.approval. The CFO certifies as to the achievement of these financial performance measures. The Senior Vice President of Human Resources The CFO certifies as to the achievement of these financial performance measures. The VP of Human Resources implements compensation-related policies and procedures and oversees the execution of each plan. The CEO makes recommendations to the HR Committee on compensation for each of the other named executive officers.annually reviews management’sthe CEO’s assessment of the performance of the 25 highest paid executives of the Company and its subsidiaries.other named executive officers. The review is conducted prior to the year in which any adjustment to6nominees, as well as a description of the experience, qualifications, attributes or skills that led the Board to conclude that the individual should be nominated for election as a director of the Company.base salary, annual incentive or long term incentive becomes effective. Both annual incentives and long term incentives are established as a percent of base salary with threshold, target, and maximum payout levels.Company.comparator benchmarking requiresand comparing peer group proxy disclosure data require certain levels of interpretation due to the complexities associated with executive compensation plans and the evolution of public company compensation disclosures.plans. The HR Committee uses the benchmarking information and the peer group proxy disclosure data provided by the compensation consultantCompensation Consultant as a general guidelineguidelines and retains the right to makemakes adjustments to compensation levels based on what the HR Committee believes is in the best interests of the Company’s stockholders. The HR Committee uses its judgment and bases its consideration of each executive’s compensation on past and expected future performance in respect to specific financial, strategic, and operating objectives; the scope of each executive’s responsibilities within the Company; the executive’s value to the Company; and a combination of competitive market survey data and proxy statement peer company data that establishes the market ranges against which compensation is benchmarked.HRAudit Committee also periodicallyhas the responsibility to oversee the Company’s policies and procedures relating to risk assessment, management, and mitigation. The Finance Committee has the responsibility to review and assess risk exposure related to the Company’s operations, including safety, environmental, financial, contingent liabilities, and other risks which may be material to the Company, as well as the activities of management in identifying, assessing, and mitigating against business, commercial, operational, financial, and personal risks associated with the Company’s products and services. The Finance Committee accomplishes this responsibility as described in “Corporate Governance — Board Committees — Finance and Risk Committee.” In addition, the Audit Committee, in its discretion, reviews the Company’s major risks and exposures, including (i) any special-purpose entities, complex financing transactions and related off-balance sheet accounting matters; and (ii) legal matters that may significantly impact the Company’s financial statements or risk management.benefits ofInternal Audit group’s findings and assessments. This committee has concluded that the Compensation Policies are not reasonably likely to have a supplemental retirement plan as a part ofmaterial adverse effect on the total compensation of the CEO.Compensation Committee Interlocks and Insider Participation2011. Mr. Hay retired from service on the Board of Directors and the HR Committee in May 2011.andJess T. Hay, Matthews, Rock, and Dr. Natalicio served on the HR Committee during the last completed fiscal year. None of the members of the HR Committee has ever served as an executive officer or employee of the Company or any of its subsidiaries. There were no compensation committee interlocks during 2008.Stockholder Communications with Directorsparties by mail.parties. Stockholders and other interested parties may contact any member of the Board, including the Presiding Director, Mr. Hay through May 3, 2009 or Mr. Best, commencing May 4, 2009, or the non-management directors as a group, any Board committee or any chair of any such committee. To communicate with the Board of Directors, any individual director or any group or committee of directors, correspondence should be addressed to the Board of Directors or any such individual director or group or committee of directors by either name or title. All such correspondence should be sent“c/ “c/o Corporate Secretary” at 2525 Stemmons Freeway, Dallas, Texas 75207.ourthe Corporate Secretary for the sole purpose of determining whether the contents represent a message to our directors. Any contents that are not in the nature of advertising, promotions of a product or service, or patently offensive material will be forwarded promptly to the addressee. In the case of communications to the Board or any group or committee of directors, the Corporate Secretary will make sufficient copies of the contents to send to each director who is a member of the group or committee to which the envelope is addressed.PROPOSAL 1 — ELECTION OF DIRECTORSOurten members.twelve members, but will decrease to eleven effective with Dr. Natalicio’s retirement at the time of the Annual Meeting of Stockholders.Corporate Governance and Directors Nominating Committee, each of the membersmember of the Board of Directors other than Dr. Natalicio has been nominated by the Board for election at the Annual Meeting to hold office until the later of the next Annual Meeting or the election of their respective successors. The director nominees are John L. Adams, Rhys J. Best, David W. Biegler, Leldon E. Echols, Ronald J. Gafford, Ronald W. Haddock, Jess T. Hay, Adrian Lajous, Diana S. Natalicio,Melendy E. Lovett, Charles W. Matthews, Douglas L. Rock, and Timothy R. Wallace. The Board of Directors has determined that all of the director nominees other than Mr. Wallace and Mr. Adams are “independent directors.” Mr. Wallace is ourthe Company’s Chairman, Chief Executive Officer, and President, and Mr. Adams served as a non-executive Vice Chairman within the three years preceding this proxy statement.President. Therefore, the Board of Directors has concluded that neither Mr. Wallace nor Mr. Adams is currentlynot an independent director.nominees.7
Nominees From 2005 — 2007, Mr. Gafford served as a member of the board of directors of Chaparral Steel Company, a leading supplier of structural steel and steel bar products.NomineesTimothy R. Wallace, 55.58. Director since 1992. Mr. Wallace has been Chairman, Chief Executive Officer, and President of the Company since 1999. From 2004 — 2008, Mr. Wallace was a director of MoneyGram International, Inc., a payment service and money transfer business.64.67. Director since 2007. MemberMr. Adams is Chairman of the Finance Committee and Risk Managementa member of the Nominating Committee. Mr. Adams served as Executive Vice President of the Company from January 1999 — June 2005, serving thereafter on a part time basis as Vice Chairman until leaving the employ of the Company to join the Board of Directors in March 2007. Prior to joining the Company, Mr. Adams was with Texas Commerce Bank (now JPMorgan Chase Bank of Texas) for 25 years, with his last position being Chairman, President, and CEO. Since 2007, he has served on several corporate and not-for- profitnot-for-profit boards. Mr. Adams is the non-executive Chairman of the Boardboard and a director of Group 1 Automotive, Inc., a company engaged in the ownership and operation of automotive dealerships and collision centers. He also serves on the Audit Committeeaudit committee and is a director of Dr Pepper Snapple Group, Inc., a company that is a leading brand owner, bottler, and distributor of non-alcoholic beverages in the U.S., Canada, and Mexico.62.65. Director since 2005. Chairman ofMr. Best serves as the FinancePresiding Director, and Risk Management Committee andis a member of Nominating Committee, the Corporate Governance and Directors NominatingFinance Committee, and the AuditHR Committee. Mr. Best served, beginning in 1999, as Chairman, President, and CEO of Lone Star Technologies, Inc., a company engaged in producingthe production and marketing of casing, tubing, line pipe, and couplings for the oil and gas, industrial, automotive, and power generation industries. He was also a director of, and remained in these positions with, Lone Star Technologies, Inc., until its acquisition by United States Steel Corporation in June 2007. Mr. Best has been engaged in private investments since 2007. He is also Chairman of Crosstex Energy, L.P., an energy company engaged in the gathering, transmission, treating, processing, and marketing of natural gas and natural gas liquids. HeMr. Best is also a member of the board of directors of Cabot Oil & Gas Corporation, a leading North American oil and gas exploration and production company; Commercial Metals Corporation, which recycles, manufactures, and markets steel and metal products and related materials; Austin Industries, Inc., a privately-held civil, commercial, and industrial construction company; and McJunkin Red Man Corporation, a privately-held company engaged in the distribution of industrial PVF products, serving the refining, chemical, petrochemical, gas distribution and transmission, oil and gas exploration and production, pharmaceutical, and power generation industries.62.65. Director since 1992. ChairmanMr. Biegler is a member of the Audit Committee, and member of the Corporate Governance and Directors Nominating Committee, and the Finance and Risk Management Committee. Mr. Biegler began serving during 2003serves as the Chairman and CEO of EstrellaSouthcross Energy, L.P.,LLC, a company engaged in the natural gas transportation and processing industry.processing. He retired as Vice Chairman of TXU CorporationCorp., a company engaged in the generation, transmission, and sale of electricity, at the end of 2001, having served TXU CorporationCorp. as President and Chief Operating Officer from 1997 — 2001. Mr. Biegler is also a director of Southwest Airlines, Inc., a major domestic airline; and Austin Industries, Inc., a privately-held civil, commercial, and industrial construction company. In addition, Mr. Biegler served as a director of Guaranty Financial Group Inc., a company conducting consumer and business banking activities, from 2008 — 2009; Dynegy, Inc., a company engaged in power generation; Southwest Airlines, Inc., a major domestic airline;generation, from 2003 — 2011; and Animal Health International, a company engaged in selling and distributing animal health products; Austin Industries, Inc., a civil, commercialproducts, from 2007 — 2011.construction company; and Guaranty Financial Group Inc., a company conducting consumer and business banking activities.enterprises. His service on the boards of other significant companies provides the Board with additional perspective on the Company’s operations.53.56. Director since 2007. MemberMr. Echols is Chairman of the Audit Committee and a member of the Human ResourcesHR Committee and the Finance Committee. He served as Executive Vice President and Chief Financial Officer of Centex Corporation (“Centex”), a residential construction company, from 2000 — 2006 when hecertified public accountant and a member of the American Institute of Certified Public Accountants and the Texas Society of CPAs. Mr. Echols has been engaged in private investments since 2006. He is a member of the Boardboard of Directorsdirectors and Chairman of the Audit Committeeaudit committee of Crosstex Energy, L.P., an energy company engaged in the gathering, transmission, treating, processing, and marketing of natural gas and natural gas liquids and Crosstex Energy, Inc., a company holding partnership interests of Crosstex Energy, L.P. He is also a member of the Boardboard of Directorsdirectors and Chairman of Hollythe audit committees of Holly/Frontier Corporation, an independent petroleum refiner;refiner, and Roofing Supply Group Holdings, Inc., a privately-held company engaged in the distribution of roofing and related construction materials;materials. In addition, Mr. Echols served as a director of TXU Corp. from 2005 — 2007. The Board has determined that Mr. Echols’ service on the audit committees of these other public companies does not impair his ability to serve on the audit committee of the Company.Colemont Corporation, a company engagedexperience gained through his service in insurance and reinsurance brokerage and related services.public accounting. His service on the boards of other significant companies provides the Board with additional perspective on the Company’s operations.59.62. Director since 1999. MemberMr. Gafford is Chairman of the Human ResourcesHR Committee and a member of the Corporate Governance and Directors Nominating Committee. Mr. Gafford has been President and Chief Executive Officer of Austin Industries, Inc., a privately-held civil, commercial, and industrial construction company, since 2001 and Chairman since 2008.8
Mr. Gafford has broad experience in managing and leading a significant industrial enterprise. His service as the Chief Executive Officer of Austin Industries, Inc. provides the Board with additional perspective on the Company’s operations.Ronald W. Haddock, 68.71. Director since 2005. Chairman of the Human Resources Committee andMr. Haddock is a member of the Audit Committee, the Nominating Committee, and the Finance Committee. Mr. Haddock was Chief Executive Officer of FINA, Inc., an international energy company, from December 1989 until his retirement in July 2000. He was also the Executive Chairman, CEO, and director of Prisma Energy International, a power generation, power distribution, and natural gas distribution company from August 2003 until its acquisition by Ashmore Energy International Limited. He currently serves as Chairman of the Boardboard and interim CEO of AEI Services, LLC, ana privately-held international power generator and distributor and natural gas distribution company; Rubicon Offshore International, an offshore oil storage and production well services company; andcompany. He is also Chairman of the Board of Safety-Kleen Systems, Inc., an environmental services, oil recycling, and refining company; and is a director of Alon USA Energy, Inc., a petroleum refining and marketing company; and Petron, a refining and marketing company based in the Philippines. Under the Board’s retirement policy, this will be the last year that he will be nominated for election to the Board.Adea Solutions, Inc., a high-tech personnel and consulting firm.Jess T. Hay, 78. Director since 1965. Chairmanleading significant enterprises. His service on the boards of other significant companies provides the Corporate Governance and Directors Nominating Committee and member ofBoard with additional perspective on the Human Resources Committee and the Finance and Risk Management Committee. Mr. Hay is the retired Chairman and Chief Executive Officer of Lomas Financial Corporation, a diversified financial services company formerly engaged principally in mortgage banking, retail banking, commercial leasing, and real estate lending, and of Lomas Mortgage USA, a mortgage banking institution. He is also Chairman of the Texas Foundation for Higher Education. Mr. Hay is a director of Viad Corp. which is a convention and event services, exhibit design and construction, and travel and recreational services company, and a director of MoneyGram International, Inc. which is a payment services and money transfer business.Company’s operations, including its international opportunities.65.68. Director since December 2006. MemberMr. Lajous is a member of the Audit Committee and the Finance and Risk Management Committee. Mr. Lajous has been Senior Energy Advisor for McKinsey & Company, a management consulting firm, and President of Petrométrica, SC.S.C., an energy consulting company, since 2001. Mr. Lajous served Pemex in several capacities between 1982 and 1999, having served as Director General and CEO from1994-1999. 1994 — 1999. Mr. Lajous is Chairman of the Oxford Institute for Energy Studies and is a director of Schlumberger, Ltd., an oilfield services company supplying technology, project management, and information solutions to the oil and gas industry; and Ternium, S.A., a company engaged in the production and distribution of semi-finished and finished steel products;products.Grupo Petroquímico Beta,leading significant industrial enterprises in Mexico, where the Company has a private Mexican chemical company.number of operations. His service on the boards of other significant companies provides the Board with additional perspective on the Company’s operations.Diana S. NatalicioMelendy E. Lovett, 68.54. Director since 1996. MemberMarch 2012. Ms. Lovett has been senior vice president, and president of the Human Resources Committee. Dr. Natalicio has beeneducation technology business, for Texas Instruments Incorporated (“TI”), a major semiconductor manufacturer, since 2004. Since 1993, she served TI in a number of capacities, including service as Vice President and Manager, Total Compensation and HR Services from 1998 — 2004. Ms. Lovett is a certified public accountant and a member of the UniversityAmerican Institute of Certified Public Accountants and the Texas at El Paso since 1988. Dr. Natalicio was appointed by President George H.W. BushSociety of CPAs.Commission on Educational Excellence for Hispanic AmericansCompany in the areas of human resources, information technology, and by President William J. Clintonaccounting. Ms. Lovett was recommended to the National Science BoardNominating Committee for service as a director by Mr. Wallace.President’s Committeeoil and gas industry in Canada.Arts and Humanities.boards of other significant companies provides the Board with additional perspective on the Company’s operations.PROPOSAL 2 — ADVISORY VOTE TO APPROVE NAMED EXECUTIVE OFFICER COMPENSATION2009,2012, subject to ratification of stockholders.9Fees of Independent Registered Public Accounting Firm for Fiscal Years 20082011 and 2007201020082011 and 2007,2010, and fees for other services rendered by Ernst & Young during those periods: 2008 2007 Audit fees $ 2,613,400 $ 2,850,750 Audit-related fees 50,760 53,800 Tax fees 355,544 119,286 All other fees — — 2011 2010 $ 2,857,000 $ 2,527,600 308,860 139,911 224,244 208,248 251,740 193,295 20082011 and 2007,2010, audit fees includesinclude fees associated with the annual audit of the Company’s financial statements, the assessment of the Company’s internal control over financial reporting as integrated with the annual audit of the Company’s financial statements, the quarterly reviews of the financial statements included in the Company’sForm 10-Q filings, statutory audits in Mexico and Europe, and consents included in other SEC filings.20082011 and 20072010 include fees for tax advice, tax planning, and tax return review.There were nootherpreparation of insurance claims and assisting in the assembly, analysis, and organization of accounting documentation with respect to the recovery of expenditures and business losses. The government contract services not included above.related to consultations on proper bidding procedures and documentation requirements for a government contract.Report of the Audit CommitteeOurThe Board of Directors has determined that fourfive of the members of the Audit Committee are “audit committee financial experts” as defined by applicable SEC rules. We operate under a written charter adopted by ourthe Board of Directors. A copy of the charter is available free of charge on ourthe Company’s website atwww.trin.netunder the heading “Investor Relations/Governance” or by writing to Trinity Industries, Inc., 2525 Stemmons Freeway, Dallas, Texas 75207c/o CorporateRelations — Governance.” Secretary.10statements in accordance with auditing standards generally accepted in the United States of America and issuing a report thereon. As provided in our charter, our responsibilities include the monitoring and oversight of these processes.20082011 were prepared in accordance with U.S. generally accepted accounting principles. We reviewed and discussed the consolidated financial statements with management and the independent auditors and discussed with the independent auditors matters required to be discussed by Statement on Auditing Standards No. 61, as amended.20082011 filed with the Securities and Exchange Commission.ChairmanRhys J. BestLeldon E. Echols2009.2012.11Total Target Compensation OverviewEXECUTIVE COMPENSATIONCompensation Discussion and AnalysisOverviewCompany’s long term strategic corporate visionfollowing Compensation Discussion and Analysis describes how the HR Committee designed the executive compensation programs and set individual pay for the executive officers named in the Summary Compensation Table.to become a premier multi-industry growth company that provides superiorowns a variety of market-leading businesses which provide products and services to the industrial, energy, transportation, and construction sectors. Managing these diverse businesses to provide growth and long-term value to our stockholders.stockholders requires a team of innovative, dedicated, and experienced executives. The Company has a clear and consistent executive compensation philosophy based on pay for performance. The Company’s executive compensation program isprograms are designed to facilitate and motivate itsdrive executive accountability for performance of the Company as a whole. The Company’s executive compensation programs contribute to a performance-driven culture where executives are expected to conduct an orderly transition from a highly successful diversified industrial cyclical company intodeliver results that promote the Company’s position as a premier, multi-industry growth company.ourthe Executive Compensation ProgramPrograms primary objectives for the Company’s executive compensation programprograms are to:• attract, motivate, and retain the key executives needed to enhance the profitability of the Company;• encourage the highest level of performance and accountability for the overall success of the Company;• provide an incentive for long term value creation for our stockholders;• align compensation with short term and long term business objectives and strategies, financial targets, and the core values of the Company; and• align compensation as appropriate with the cyclical nature of the Company’s businesses.ourthe Executive Compensation ProgramProgramsOurprogram is intended toprograms reinforce the importance of performance and accountability Company-wide and at both the individual and corporate achievement levels. Ourlevel. The Company’s executive compensation program isprograms are designed to:• provide a reasonable balance between short term and long term compensation;• provide a reasonable mix of fixed and incentive-based compensation;• retain key executives through the cycles of our businesses;• be competitive with our compensation comparator company group;• use equity-based awards, stock ownership guidelines, and annual incentives that are linked to stockholder value; and• be transparent and easy to understand.program hasprograms have four key components:• base salary;• an executive perquisites payment;• annual incentive plans designed to focus on short term performance; and• long term incentive plans designed to encourage executives to promote the Company’s position as a premier multi-industry growth company.Business Plan and Operational Performance LinkageEach year management prepares strategic review ofbase salary;businesses as well asshort-term performance; andCompanyCompany’s position as a whole. The Company’s strategies are linked to the corporate vision and provide a multi-year projection of financial results, including fully diluted earnings per share (referred to as “EPS”) and return on equity (referred to as “ROE”). This business plan is reviewed and discussed annually with the Board of Directors. Following its discussions withpremier, multi-industry company.12the Board on the business plan, management prepares operational plans and budgets that provide specific performance measurements and goals required to achieve the strategies for the next year. The Company’s budgets are reviewed and approved annually by the Board of Directors.Executive incentive target goals are linked to the Company’s business plans and budget. Threshold, target, and maximum level performance goals are established for the performance-based long term incentive compensation plan. These performance-based long term incentive compensation financial goals are a means of encouraging management to focus on initiatives that maximize stockholder return over the long term. The HR Committee uses the Board-approved annual budget as a guideline when establishing the financial performance goals for the annual incentive compensation plan. These annual incentive compensation financial goals are used to encourage management to focus resources on key short term earnings objectives.The Company notes that the performance goals are part of the Company’s incentive program and do not correspond to any financial guidance that the Company has provided to the investment community for 2009 or that the Company will provide for future years and should not be considered as statements of the Company’s expectations or estimates.The Named Executive OfficersThe Board of Directors has delegated to the HR Committee oversight of our executive compensation program. The HR Committee reviews and recommends to the independent directors the compensation for the CEO. The independent directors approve the CEO’s compensation. The HR Committee reviews and approves the compensation of the CFO and the other named executive officers. The five named executive officers for 2008 were:• Timothy R. Wallace, Chairman, Chief Executive Officer, and President• William A. McWhirter, Senior Vice President and Chief Financial Officer• Mark W. Stiles, Senior Vice President and Group President• D. Stephen Menzies, Senior Vice President and Group President• S. Theis Rice, Vice President and Chief Legal OfficerCompetitive Analysis through BenchmarkingOne of the HR Committee’s primary objectives related to the executive compensation program is to “attract, motivate, and retain” the key executives needed to enhance the profitability of the Company. To this end, the HR Committee directs its compensation consultant to perform a total compensation study and include benchmarking information on each of the named executive officers. During 2007, the HR Committee retained Longnecker & Associates (referred to as “L&A”) as its compensation consultant to provide guidance for setting 2008 base salaries, annual incentive compensation, and long term incentive compensation for executives.The benchmarks for the 50th percentile (market median) and 75th percentile were a combination of comparator company proxy statement data (referred to as “comparator companies”) and market survey data. The HR Committee selected comparator companies to benchmark based on criteria that included:• industry (manufacturing and industrial);• size (based on revenues, assets, market capitalization, and total number of employees);• competitiveness (companies that potentially compete with the Company for executive talent); and• comparable executive positions (companies with executive positions with similar breadth, complexity, and scope of responsibility).The comparator companies for each of the named executive officers for their 2008 compensation is shown in Table 1 and represent companies whose revenues are within a range of +50% and -50% of Trinity’s 2007 revenue of $3.8 billion or assets with values of +50% and -50% of the asset valuation of Trinity. Additionally, for its proxy analysis, L&A included only comparator companies that filed in the new proxy format to keep the analysis as consistent as possible.13Table 1 — Comparator Companies Used for Proxy Statement Data by Named Executive Officer Position Benchmarked CEO CFO/SVP EVP/SVP EVP/SVP VP/CLO Comparator Companies Timothy R. Wallace William A. McWhirter Mark W. Stiles D. Stephen Menzies S. Theis Rice AMETEK, Inc. X X X X Briggs & Stratton Corporation X X Carlisle Companies Incorporated X X X X Carpenter Technology Corporation X X X X X Chicago Bridge & Iron Company N.V. X X X X Crane Co. X X X X X Flowserve Corporation X X X X X Harsco Corporation X X X X X Kennametal Inc. X X X X Leggett & Platt, Incorporated X X X X Lennox International Inc. X X X X Roper Industries, Inc. X X X X Teleflex Incorporated X X X X Terex Corporation X X X X X The Manitowoc Company X X X X The Stanley Works X X X X The Timken Company X X X X Worthington Industries, Inc. X X Total Comparator Companies 18 18 16 16 5 As noted in Table 1, Mr. Wallace and Mr. McWhirter were benchmarked against all 18 comparator companies. Mr. Stiles and Mr. Menzies were benchmarked against 16 of the 18 comparator companies and were not benchmarked against Briggs & Stratton Corporation or Worthington Industries, Inc. because they did not report comparable operations positions. Mr. Stiles and Mr. Menzies were benchmarked against 23 companies, seven of which were not included in our primary comparator group (American Standard Companies, Ball Corporation, Burlington Northern Santa Fe Corporation, Dover Corporation, Eaton Corporation, Ingersoll-Rand Company Limited and ITT Corporation) to capture and include directly applicable industry specific companies for their lines of business. Mr. Rice’s position was benchmarked against five comparator companies because the position of Chief Legal Officer was not included in the named executive officer disclosure of the other comparator companies.In addition to the comparator company proxy statement data, comparator company comparison data for base salary, cash annual incentives and long term incentives was obtained from a combination of the following published survey sources — Economic Research Institute, 2007 ERI Executive Compensation Assessor (“ERI”); Watson Wyatt, 2007/2008 Top Management Compensation — Industry Report (“Watson Wyatt”); William Mercer, 2007 Executive Compensation Survey (“Mercer”) and Hewitt, TCM Online Executive, United States 2007 Survey (“Hewitt TCM”). All the named executive officers were compared to the four surveys. Base salary data from the ERI survey reflected the Industrial Machinery and Equipment industry using revenue ranges based on the specific named executive officer’s responsibility and corporate or business unit revenue. Data for all components of pay from the Watson Wyatt Survey reflected the Durable Goods Manufacturing industry for companies with revenues similar to the Company. The Mercer survey cash compensation data represented the Manufacturing industry with companies with revenues ranging from $2 billion to $5 billion. Finally, the Hewitt TCM survey data for all14total compensation levels that vary from the target percentiles described above, (ii) the periodic and relative impact on earnings of external business conditions outside the control of the executives, and (iii) the cyclical nature of the Company’s businesses.components of pay reflected revenue ranges based on corporate revenue ($1.9 billion to $5.7 billion) or business unit revenue as applicable.Based on the 2007/2008 WorldatWork Total Salary Increase Budget Survey, all published survey and proxy data was time-adjusted to January 1, 2008 using the survey recommended annual adjustment factor of 4.0%.After determining the most appropriate job match for each published survey and identifying the appropriate proxy company comparator group for each named executive officer position, L&A conducted its analysis for each component of pay. L&A benchmarked the market using a combination of comparator company proxy data and published industry survey data. L&A then met with management, including the CEO, to obtain its views on the similarities and differences in responsibilities between the Trinity positions and those in the comparator group that may affect the level of compensation. After this discussion with management and reviewing the data from the comparator groups, L&A provided a competitive market value range recommendation for each executive position. L&A’s recommendations on market value ranges, along with the CEO’s compensation recommendations for each named executive officer other than himself, were presented to the HR Committee.The followingThis discussion should be read in conjunction with the “SummarySummary Compensation Table”Table and related tables and narrative disclosuredisclosures that followsfollow the tables which set forth the compensation of ourthe CEO and the other named executive officers.Total Target Compensation Overviewbases its consideration ofconsiders each named executive officer’s compensation on:based on the overall objectives of the Company’s compensation programs and the following:• past and expected future performance in respect to specific financial, strategic, and operating objectives;• the scope of each executive’s responsibilities within the Company;• the executive’s value to the Company; and• a combination of competitive market survey data and comparator company proxy data that establishes the market ranges against which compensation is benchmarked.comparator benchmarking against market survey data and the comparison of peer group proxy disclosure data requires certain levelsa degree of interpretation due to the potential differences in position scope, the complexities associated with executive compensation plans, and the evolution of public company compensation disclosures. The HR Committee useduses the benchmarking information and the peer group proxy disclosures provided by L&Athe Compensation Consultant as a general guidelineguidance and retains the right to makemakes adjustments to compensation levels based on what the HR Committee believes isto be consistent with the overall compensation objectives of the Company and in the best long-term interests of the Company’s stockholders.to be between the 50th and 75th percentile of total target compensation paid tofor executives in similar positions at companies comprisedas derived from market survey data. The HR Committee believes this range is appropriate and sufficient to attract, motivate, and retain the key executives needed to enhance the performance and profitability of both the comparator company proxy group and survey data.Company. The HR Committee develops the total target compensation amounts using the criteriaobjectives noted above and the percentile targetsrange as general guidelines. Total target compensation targets may be set closer to the market 50th percentile if named executive officers are in the early stages of their careers or relatively new to their current positions. Total target compensation targets may be set closer to the market 75th percentile if named executive officers are seasoned executives with seniority in their roles at the Company or have extensive work experience in similar positions at other companies whichelsewhere that the CompanyHR Committee has determined provides additional value to the Company.Based on its review of benchmark and tally sheet information and data,value. The HR Committee considers this range together with input from management, the HR Committee determined that no adjustments were needed for 2008 other than a base pay increase for Mr. Rice who was not aan assessment of each named executive officer under the additional considerations mentioned above. The HR Committee also considers (i) the relatively high percentage of performance-based compensation, which may result in 2007.15
Allocation of CompensationWhileAlthough there is no pre-established policy or target for the allocation between short termshort-term and long term,long-term, or fixed and incentive-based compensation, the aggregate results of the Company’s compensation and benefits programprograms for named executive officers have generally reflected the following:following principles.Short term compensation versus long term compensationShort-term Compensation Versus Long-term Compensationshort termshort-term compensation is normally paid in cash and consists of three primary components:• base salary;• annual incentive compensation; and• an executive perquisite payment.short termshort-term compensation (the sum of the short termshort-term components listed above) generally falls within a range of 35% to 60% of total compensation.60%65% of total compensation. The HR Committee believes that this percentage range appropriately rewards the aggregate of short term compensation and long term compensation described below.A named executive officer’s long termofficers for meeting short-term business objectives, while also maintaining their focus on long-term Company performance.consists of three primary components:• retirement benefits;• deferred compensation; and• annual long term incentive compensation that is typically paid with equity awards.A namedto attract, motivate, and retain top quality executive officer’s long term compensation (the sum of the long term components listed above) generally falls within a range of 40% to 60% of the aggregate of long term compensation and short term compensation described above.Fixed versus incentive-based compensationThe Company’s objectives includemanagement, while encouraging the highest level of performance and accountability for the overall providing an incentiveto create long-term value for long term value creation for our stockholders. A named executive officer’s fixed compensation is established to appropriately and fairly compensate the executive given the breadth, complexity, and scope of the responsibilities required by the position. The incentive-based compensation component is based on achievement ofachieving measurable goals or has vesting requirements that may or may not be achieved.goals. The named executive officer’s incentive-based compensation includes the following components:• annual incentives typically paid in cash; and• long term incentives typically paid through equity awards.greater setbroader range of responsibilities as compared tothan the other named executive officers, including having ultimate responsibility for the overall success of the Company. As a result,The HR Committee has therefore determined it is appropriate that he hasshould have the highest percentage of incentive-based target compensation.ElementsThe Named Executive OfficersPosition Compared CEO SVP/CFO EVP/SVP EVP/SVP SVP/CLO Peer Companies Timothy R.
Wallace James E.
Perry X X X X X X X X X X X X X X X X X X X X X X X X X X X X X X X X X X X X X X X X X X X X X X X X X X X X X X X X X X X X X X 14 16 14 14 4 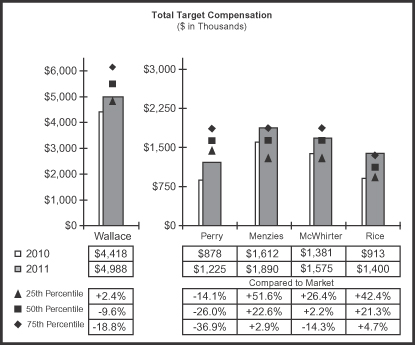
elementscomponents of total target compensation, how these elementscomponents were applied to each named executive officer, and the analysis of why such amounts were paidset or set.paid.provideattract, motivate, and retain key executives by providing a consistent level of pay that appropriately and fairly compensates the executive for the breadth, complexity, and scope of responsibility forinherent in the position and enables the Company to achieve its objectives of attracting, motivating, and retaining key executives.position. The HR Committee targets the 50th percentile of the market (the market(market median) as a starting point for discussions pertaining to an executive’s base salary. After evaluating the16incentive compensation programs for the coming year.benchmark data and the peer group proxy disclosure data, the CEO discusses with the HR Committee his evaluation of each named executive officer’sofficer, excluding himself. The discussion includes performance for the past year; specific achievements he believes should be highlighted; changes in the breadth, scope, or complexity of responsibilityresponsibilities that have occurred or will occur in the next year; operating results; organizational improvements; expected future performance; and relative pay equity among the named executive officers.Benchmarking Analysis2011 Base SalaryFor each named executive officer, L&A determined an overall 50th percentile (market median) and 75th percentile by equally weighting the data from the relevant data sources and proxy statement data from the comparator companies. The data from published surveys and proxy statements were averaged to arrive at an overall benchmark forpay. The base salary of each named executive officer for 2008 as compared to the percentage above or below the 50th and 75th percentiles is set forth in Table 2.Table 2 — Base Salary Benchmarking Named Executive Officer Base Salary 50th Percentile(1) 75th Percentile(1) Timothy R. Wallace $ 950,000 3% above 8% below William A. McWhirter $ 425,000 2% above 12% below Mark W. Stiles $ 520,000 20% above 1% below D. Stephen Menzies $ 520,000 18% above 2% below S. Theis Rice $ 365,000 9% above 7% below (1)Indicates the position of the Company’s 2008 base salary as compared to the market 50th and 75th percentiles using the following formulas: The Company 2008 base salary dollar amount divided by 2008 market 50th percentile dollar amount and the Company 2008 base salary dollar amount divided by 2008 market 75th percentile dollar amount.Base Salary ResultsThe base salaries for 2008 for the named executive officers, can be found in the “Summary Compensation Table.” The base salary of all ofHR Committee considered individual performance, responsibilities, motivation to drive results, internal compensation equity, market comparisons, and Mr. Wallace’s recommendations. In addition, the named executive officers was withinHR Committee considered that the compensation range established for each position. The 2008 base salaries for Messrs. Wallace,Menzies and McWhirter Stiles and Menzies (named executive officers inhad remained unchanged since 2007 and 2008) were not increased from their applicable base salaries at their request.Mr. Rice’s had remained unchanged since 2008. At Mr. Wallace’s request, his base salary has remained the same since 2006 at2006.request which was approved bycontinued success and exceptional performance as CFO and his efforts in maintaining a high level of liquidity for the independent directors.Company as it seeks opportunities for growth. Messrs. Menzies and McWhirter received increases to their base salaries in recognition of their leadership and expertise and the successful performance of their respective businesses in the face of significant economic uncertainty. Mr. Rice’s base salary was increased by 4.3% effective January 2008 to recognize his performance.expertise in meeting the demands of litigation and complex contractual and regulatory activities and to account for the assumption of responsibility for the human resources function.notbelow the general 50th to 75th percentile target range as he was relatively new in his role. Mr. Menzies’ base salary was slightly above this targeted range as he is a seasoned executive with seniority in his role and has extensive work experience in similar roles prior to joining the Company. Mr. Wallace’s base salary has remained below the targeted range based on his requests over the past several years.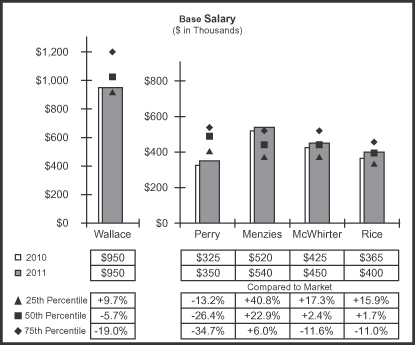
2007.2012 in recognition of his continued success and exceptional performance as CFO, and his efforts in managing the Company’s balance sheet and high liquidity while the Company experienced cyclical growth. Messrs. Menzies and McWhirter received base salary increases for 2012 to recognize the strong revenue and operating performance in their respective businesses. Mr. Rice received a 2012 base salary increase for his high-quality job performance and the successful integration of additional executive leadership responsibilities for the human resources function.country, health, dinner, luncheon or airport club dues,memberships, automobile allowances, and fees and expenses incurred in financial planning and income tax preparation. Currently the Executive Perquisite Allowance is 10%The Company believes that payment of base salary forthis allowance serves as part of a competitive compensation program and enhances the named executive officers. The level of perquisites is tiedofficers’ ability to conduct the Company’s earnings for the previous year. The HR Committee can modify the percentage based on the Company’s performance for the previous year or any other circumstance.business. Each named executive officer is required to use $6,000 of the amount received under the Executive Perquisite Allowance to maintain a four-door sedan, includingCompany-approved levels of automobile insurance and other maintenance, and to forego expense reimbursement for the first 10,000 business miles annually. In 2008,2011, the Executive Perquisite AllowanceCompany did not reimburse any named executive officer for mileage in excess of 10,000 miles.20082011 can be found in the footnotes and narrative disclosure pertaining to the “Summary Compensation Table.”OtherIncentive Compensation OverviewMr. Menzies’s commuting expenses2008areas that are key to the Company’s performance, and 2009that performance levels for this compensation should be appropriately difficult to achieve. All members of management and other key employees, including the named executive officers, participate in the Company’s incentive compensation programs and have the same performance levels, which fosters collaboration between the participants across the Company’s business groups.subject to reimbursement byproducing the Company up to $50,000 perdesired results. At the end of each year, the HR Committee reviews the results of the programs and a gross upfurther assesses the programs’ effectiveness over the preceding year. This review forms the foundation for applicable federal taxes. After 2009, the Company will not provide any17reimbursement to Mr. Menzies for commuting expenses. Mr. Menzies’s 2007 commuting expenses of $41,276 were grossed up by $23,674 for applicable taxes. Mr. Menzies’s 2008 commuting expenses of $42,579 were grossed up by $24,422 for applicable taxes.Annual Incentive CompensationOurourthe Company’s total target compensation program. ItThe AIP is designed to link and reinforce our executive decision-making and performance with the Company’s annual goals, reinforce these goals, and ensure the highest level ofwell as ensure the highest level of accountability for the overall success of the Company. Since annual incentive compensation (referred to as “AIC”) comprised between 35% and 40% of a named executive officer’s total target compensation package for 2008, this portion of our compensation programwhole. The AIP provides significant motivation for the named executive officers to achieve the performance goals pre-established by the HR Committee.AIC levels are expressed as In 2011, this program comprised approximately 20% of a percentage of base salary. named executive officer’s total target compensation.CompanyHR Committee establishes AIC threshold, target, and maximum financial performance levels for each named executive officer. AIC is normally paid out in cash because it is an award that recognizes current performance.Benchmarking Annual Incentive CompensationAIC payouts are tied to the performance of the Company as well as an individual’s performance. To determine competitive market benchmarks for AIC targets, L&A used published survey data from the Wyatt, Mercer, and Hewitt TCM surveys. Based on the benchmark data, the AIC target levels for Messrs. Wallace, McWhirter, Stiles and Menzies fell below the 50th percentile. The AIC target level for Mr. Rice fell between the 50th and 75th percentile. The AIC target levels for each named executive officer for 2008 as compared to the percentage above or below the 50th and 75th percentiles is set forth in Table 3.Table 3 — Annual Incentive Compensation Targets for Named Executive OfficersAIC TargetNamed Executive Officer(% of Base Salary)50th Percentile(1)75th Percentile(1)Timothy R. Wallace90%17% below50% belowWilliam A. McWhirter60%16% below45% belowMark W. Stiles60%8% below43% belowD. Stephen Menzies60%10% below43% belowS. Theis Rice50%11% above29% below(1)Indicates the position of the Company’s 2008 AIC target dollar value as compared to the market 50th and 75th percentiles using the following formulas: The Company’s 2008 AIC target dollar value divided by 2008 market 50th percentile AIC target dollar value and the Company’s 2008 AIC target dollar value divided by 2008 market 75th percentile AIC target dollar value.Establishing Annual Incentive Payout Levelspotential annual incentive compensation. The HR Committee establishes performance payoutbelieves that each of these levels forshould represent improvement in the componentsselected areas emphasized and should require an appropriate amount of the AIC consisting of threshold, target, maximum, and Exceptional Performance Incentive Program (“EPIP”). EPIP is an amounteffort to achieve. The HR Committee believes that could be earned by the named executive officers above their normal maximum. EPIP is used to focus management on maximizing improvement of EPS. A named executive officer will not receive any AIC until(i) the threshold performance goallevel should require a level of achievement appropriate for earning initial amounts of annual incentive compensation, (ii) the target performance level should represent a considerable but reasonable level of performance improvement, and (iii) the maximum performance level should represent an aggressive level of performance improvement that will be highly difficult to achieve. For calculation purposes, program participants become eligible to receive performance-based annual incentive compensation when the threshold performance level is met or surpassed. The actualmet. For Company performance falling between the specified performance levels, the amount of AIC awardedannual incentive compensation earned is commensurate with the financial performance achievements and is prorated between the threshold level and EPIP level.prorated.criteriametrics, performance levels, or other elements of an executive’s AIP.the AIP with the objective of assuring management’s focus on appropriate performance metrics. The HR Committee also may electchoose to: (i) modify or discontinue the AIP at any time, overall or as to provide theany one or more named executive officers, and other select key executivesincluding non-payment or partial payment of incentive compensation or granting equity in lieu of cash compensation, with the opportunity to earn additional AIC for achievement of measurable Company-based financial results beyond the normal cap placed on the AIC payout. The Company’sor without notice; (ii) modify an executive’s AIP may contain elements designed to focus management on other performance criteria.18The HR Committee established the AIC target levels and AIC maximum levels after considering the benchmark data provided by L&A. The HR Committee retains the exclusive right to modify the level of participation for the AIPpercentages if an executive’s responsibilities change significantly and tosignificantly; (iii) reduce a named executive officer’s AICannual incentive compensation on a discretionary basis for failing to meet normal job performance expectations.expectations; (iv) recoup all or any portion of annual incentive compensation under circumstances where the Company restates its financial statements; or (v) remove individuals from the AIP at any time. The HR Committee may remove any extraordinary, unusual, or non-recurring items of income or expense from the calculation of financial goal attainment and incentive compensation.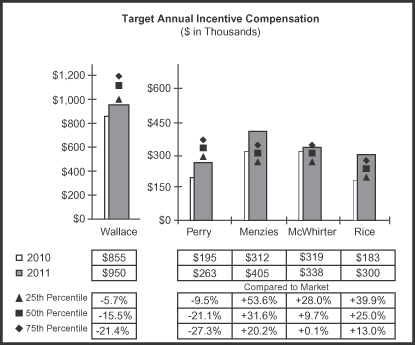
Setting 20082011 Annual Incentive Compensation Performance GoalsLevels and Payouts2011 Annual Incentive Program Metrics Financial Metric Threshold Target Maximum $0.90 $1.20 $1.50 Named Executive Officer Potential Annual Incentive Compensation Payout as a % of Base Salary 40% 100% 200% 30% 75% 150% best short termexclusive performance metric for the Company’s AIP was EPS. The EPS goals were set above2012 AIP.goals established for 2007 by 5.3% at threshold, 8.0% at target,Company anticipates continued earnings growth over 2011, and 5.9% at maximum based on expected improvements from 2007. The range between threshold and maximum performance was recommended by management to the HR Committee and approved by the HR Committee. At the time theagain established performance goals were implemented, this performance goal range reflected the appropriate potential challenges and opportunities associated with the Company’s 2008 budget. In addition, to encourage management to stretch for significant earnings improvement, the EPIP level was established at 5.4% above the 2007 EPIP level. Based on the recommendationslevels reflective of the HR Committee, the goals for Mr. Wallace were approved by the independent directors.The 2008 threshold, target, maximum, and EPIP levels for percentage of salary and performance goals are set forth in Table 4.Table 4 — 2008 Annual Incentive Compensation Performance Goals Base Salary Threshold(1) Target(2) Maximum(2) EPIP Financial Measurement:
Company EPS $3.00 $3.38 $3.60 $3.93 Timothy R. Wallace $950,000 $427,500 $855,000 $1,710,000 $2,280,000 % of base salary earned at each level 45% 90% 180% 240% William A. McWhirter $425,000 $127,500 $255,000 $510,000 $765,000 % of base salary earned at each level 30% 60% 120% 180% Mark W. Stiles $520,000 $156,000 $312,000 $624,000 $936,000 % of base salary earned at each level 30% 60% 120% 180% D. Stephen Menzies $520,000 $156,000 $312,000 $624,000 $936,000 % of base salary earned at each level 30% 60% 120% 180% S. Theis Rice $365,000 $91,250 $182,500 $319,375 $538,375 % of base salary earned at each level 25% 50% 87.5% 147.5% (1)Threshold is set at 50% of a named executive officer’s AIC target as a reasonable amount of compensation for achieving the financial goals for threshold.(2)The AIC target and maximum levels are based on benchmark data, as previously discussed.2008 Financial Results and Payoutsuch growth. The HR Committee reviewsestablished the 2012 AIP performance levels as follows: (i) threshold at $2.00 of EPS, representing an achievable 21% growth in EPS over the prior year; (ii) target at $2.45 of EPS, representing a considerable but reasonable 49% growth in EPS over the prior year; and approves AIP awards after(iii) maximum at $2.80 of EPS, representing an aggressive growth of 70% over the Company’s annual financial results have been audited. For 2008, the AIP target was equal to Company EPS of $3.38 and the AIP maximum was equal to Company EPS of $3.60. The 2008 AIP payout was based on Company EPS of $3.59. Although the Company’s financial performance for 2008 was comparable to the Company’s financial performance in 2007, the AIP awards for 2008 were less than the payouts for the 2007 AIP awards because the 2008 target and maximum goals for the AIP awards were higher than the 2007 target and maximum goals for the AIP awards by 8% and 6%, respectively. Since the calculation of AIC exceeded the target level but was slightly less than the maximum level, the amount of 2008 AIP awards paid to the named executive officers for the Company’s EPS results was prorated accordingly. The HR19Committee did not exercise any negative discretion in the 2008 incentive payouts. See the “Summary Compensation Table” for the actual payments for 2008.The Board, upon the recommendation of the HR Committee, determined that commencing with the 2009 AIP, the EPIP performance goal and payout level will be eliminated.Long Term Incentive CompensationLong term incentives (referred to as “LTI”) are a key part of our executive compensation package and are provided through the stockholder-approved stock option and incentive plan. Their overarching purpose is to:• attract, develop, and retain strong management through stock ownership;• align employee interests with those of the Company’s stockholders;• encourage key employees to look beyond the annual planning horizon for ways to improve the Company, strategically position its businesses, and profitably grow earnings; and• assist the Company’s successful transition to a multi-industry growth company from a cyclical industrial company.prior year. The HR Committee annually establishes a LTI compensation target as a percentage of base salarybelieves these levels reflect appropriate motivation and usesreward for potential EPS growth in 2012. target to compute the total target value of equity that can be granted to an executive. Due to the cyclical nature of the Company’s businesses, the HR Committee directed management to calculate the value of an executive’s equity grant based on the one-year average stock price.The Company has a multi-year performance-based LTI program. An executive’s target grant can be composed of three types of long term incentives: (1) performance-based restricted stock; (2) time-based restricted stock; and (3) stock options.Ratio of Restricted Stock Grant AwardsThe HR Committee establishes guidelines for the ratio that it expects to award through restricted stock grants. The Company’s named executive officers can earn 60% of their LTI target compensation in the form of performance-based restricted stock and 40% in the form of time-based restricted stock for 2008 and 2009. During 2010 and 2011, the named executive officers can earn up to 75% of their LTI target compensation in the form of performance-based restricted stock and 25% in the form of time-based restricted stock. Due to the uncertain global economic conditions, the 2012 long term incentive target levels for performance-based restricted stock were not set and when established, will be based on a performance period that would qualify for tax deductibility under Internal Revenue Code of 1986, as amended (the “Code”) Section 162(m). The performance period will be considered at a future HR Committee meeting. Performance-Based Time-Based Restricted Stock Restricted Stock % of LTI Compensation % of LTI Compensation Grant Year Target Level Target Level Measurement Period 2008 60 % 40 % 2006 and 2007 2009 60 % 40 % 2006 – 08 2010 75 % 25 % 2007 – 09 2011 75 % 25 % 2008 – 10 The HR Committee’s practice is to make the awards on the date of the Company’s Annual Meeting of Stockholders, which is after the first quarter financial results have been disclosed. Prior to making the awards, the HR Committee confirms there is no pending undisclosed material information.20P.B. Unit Program.Performance-Based LTI ProgramDuring 2006, the Company began to phase in a three-year performance-based restricted stock program to align compensation with our long term business vision, objectives, and strategies. The performance-based program is contingent on the achievement of a three-year performance measurement that is based on cumulative EPS and average ROE.Each year management prepares amulti-year business plan which provides a projection of financial results, including EPS and ROE. The plan is reviewed annually with the Board of Directors, which in turn influences the establishment of the long term goals and objectives for each of the business units within the Company and for the Company itself.The HR Committee relies heavily on the Board of Directors approvedmulti-year business plan when establishing the target level performance goals for the performance-based LTI compensation plan. The LTI program is linked to the strategic objectives of the Company. These financial goals are a means of recognizing and compensating management for the ability to identify a sound business plan for the business units and the Company that maximizes stockholder return over the long term. The performance-based LTI compensation threshold level and target level performance goals for all named executive officers and the cumulative Company EPS and average ROE for the specified measurement periods are shown in Table 5.The Company notes that the performance goals are part of the Company’s incentive program and do not correspond to any financial guidance that the Company has provided to the investment community for 2009 or that the Company will provide for future years and should, therefore, not be considered as statements of the Company’s expectations or estimates.Table 5 — Performance-BasedCompensation Thresholdis to align executives’ interests with those of the Company’s stockholders and Target LevelsEarnings Per Share Portion Date Target Performance-Based Cumulative EPS LTI EPS LTI Established LTI Compensation Measurement Period Threshold Target January 2006 Grant Awarded in May 2008 Total of 2006 and 2007 $ 2.67 $ 3.82 January 2006 Grant To Be Awarded in May 2009 Total of 2006, 2007 and 2008 $ 4.63 $ 6.61 January 2007 Grant To Be Awarded in May 2010 Total of 2007, 2008 and 2009 $ 7.18 $ 10.25 January 2008 Grant To Be Awarded in May 2011 Total of 2008, 2009 and 2010 $ 8.66 $ 12.37 Returnencourage executives to look beyond the annual planning horizon for ways to improve the Company’s earnings and returns over the longer term through a variety of strategic and operational initiatives.Equity Portion Date Target Performance-Based Cumulative ROE LTI ROE LTI Established LTI Compensation Measurement Period Threshold Target January 2006 Grant Awarded in May 2008 Average of 2006 and 2007 9.04% 11.30 % January 2006 Grant To Be Awarded in May 2009 Average of 2006, 2007 and 2008 9.89% 12.37 % January 2007 Grant To Be Awarded in May 2010 Average of 2007, 2008 and 2009 12.43% 15.53 % January 2008 Grant To Be Awarded in May 2011 Average of 2008, 2009 and 2010 12.96% 16.20 % Ifachievement of pre-established performance levels, and retention-based awards, which vest over a period of time. The named executive officers and other senior executives are eligible to participate in both the performance-based and retention-based components of the program. Other members of management and key employees participate only in the retention-based component.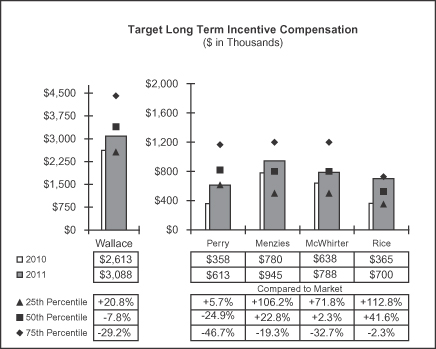
anticipates payinggrants to each program participant the corresponding amount of restricted stock, which then vests over a specified period of time. The design of the P.B. Restricted Stock Program has resulted in grants that ultimately vest five to seven years after the relevant performance period began.the corresponding amountwere granted 75% of their respective target LTI compensation as performance-based restricted stock. However, for grants made through 2009,stock units under the HR Committee may reduceP.B. Unit Program. These units are non-voting and do not pay dividends. At the end of the applicable performance period, the named executive officers can earn from 30% of the target grant at the threshold level up to 200% of the target grant at the maximum level. If the Company achieves target level EPS, the named executive officers will retain 100% of their grant under the P.B. Unit Program. The named executive officers will earn 0% of the target grant if the Company does not achieve the threshold level EPS. For Company performance falling between the performance levels, the amount of LTI awarded will be prorated. The same approach will be used for 2012 grants under the award even ifP.B. Unit Program. See the performance goals are achieved, by exercising its own discretion, and has not limited“Grants of Plan-Based Awards Table” for the circumstancesspecific number of units granted to each named executive officer in which it may exercise such negative discretion. Beginning with grants made in 2010,2011 under the HR Committee has determined that it will not retain discretion to reduce performance-based awards earned up to the target level.21Time-BasedRetention-Based Restricted Stock Grants in 2011Time-basedformpart of LTI compensation. The HR Committee awards time-basedretention-based restricted stock to executives as a means for retaining,way of facilitating retention, motivating recipients to drive results, and rewarding an executive.recipients’ performance. Such awards also help maintain appropriate compensation balance among executives, given their respective roles and responsibilities.2008,2011, after a review of the named executive officers’ contributions to the long termlong-term value of the Company and the financial performance of the Company for the prior year, and based on Mr. Wallace’s recommendation, the HR Committee awarded Messrs. Perry, Menzies, McWhirter, Stiles, and Menzies 13%, 6%, and 19%, respectively,Rice 5,000 shares of their LTI compensation as time-basedretention-based restricted stock. These time-basedretention-based restricted stock grants vest on May 15, 2016. Recipients of retention-based restricted stock are entitled to dividends and to vote the shares during the restricted period. At his request, Mr. Wallace did not receive any retention-based restricted stock. In addition, the HR Committee approved an additional retention-based grant of 30,000 shares of restricted stock to Mr. Perry in fivelight of his contributions to the long-term value and financial performance of the Company, and to encourage retention by establishing continual vesting over a multi-year period. These shares vest in three equal annual installments beginning on May 15,th following the first anniversary 2015. In addition, Mr. Perry was awarded 20,000 shares of the grant.In January 2008, upon the successful completion of Mr. McWhirter’s third year as the Company’s CFO, the HR Committee made a special award of 15,000 restricted shares. These shares vest on the earlier of (i)stock vesting at age 65 (ii) when Mr. McWhirter’s age plus years of vested service equal 80, (iii) death, disability or change in control, or (iv) consent of the HR Committee after three years from the date of grant.to ensure long-term retention. The HR Committee granted the shares to increase Mr. McWhirter’s equity ownership and to recognize his contributions to the Company during his third year as CFO. Additionally, the extended time-vestingtime vesting represents an economical method for the Company to provide an incentive for Mr. McWhirter to remain with the Company as well asretention and to supplement his retirement as Mr. McWhirter is not a participant in the Company’s Supplemental Retirement Plan. Mr. McWhirter is entitled to receive dividends on the restricted stock and to vote the shares during the restricted period.Stock OptionsOn December 10, 2008, the Board of Directors granted stock options to the named executive officers and the other key employees who were previously eligible for the EPIP program which was eliminated for 2009. As a result of eliminating the future opportunity for the named executive officers and the other key employees to earn short-term cash compensation above the maximum payout level pursuant to the EPIP, the Board of Directors granted stock options that vest on May 15, 2012 or earlier in the event of death, disability, retirement, or change in control and were granted with an exercise price equal to 110% of the Company’s closing stock price on the date of grant, or $16.24 per share. See “Grants of Plan-Based Awards Table” for information on the grants to the named executive officers. Stock options awarded to the named executive officers are also included in the “Summary Compensation Table” under the column headed “Option Awards.” The cost of stock options is amortized in accordance with “Statement of Financial Accounting Standard No. 123RShare-Based Payments” (“SFAS 123R”).Benchmarking LTI Compensation TargetsFor each named executive officer, L&A determined a competitive market LTI value. This value was based on the average of the relevant survey data and proxy statement 50th percentile data. The HR Committee approved the LTI compensation target levels for all of the named executive officers for 2008, except for Mr. Wallace, whose target levels were approved by the independent directors. The LTI compensation target levels were set at 275% of the CEO’s base salary and 150% of base salary for Messrs. McWhirter, Stiles, and Menzies. Mr. Rice’s LTI target level was set at 100% of base salary. All named executive officer LTI compensation target levels were below the 50th percentile. Mr. Wallace’s LTI compensation target was 18% below the 50th percentile. Mr. McWhirter’s LTI compensation target was 33% below the 50th percentile. Messrs. Stiles and Menzies’ LTI compensation targets were 17% and 18%, respectively, below the 50th percentile. Mr. Rice’s LTI compensation target was 45% below the 50th percentile.The LTI compensation target levels are below the 50th percentile due to the fact that the Company’s LTI plan is based on multiple years. The HR Committee is closely monitoring the benchmarking process during the interim transition period but does not plan to make any adjustments until the grants are based on the three year performance windows. The HR Committee believes these targets are currently sufficient in size to motivate the executives and are in the best interest of the stockholders and that the size of the grant provides the named executive officers sufficient compensation.22retirement.Performance-BasedP.B. Restricted Stock Award Calculation MethodProgram Performance Levels for Future GrantsFor awards of performance-based restricted stock to be made throughwill consider awardingestablished four performance metrics for the performance-based grants ifP.B. Restricted Stock Program for the Company achieves its pre-established2010-2011 performance goals set forth in Table 5. The calculation ofperiod (grants earned for this performance-based LTI compensation is determined by the cumulative result of weighting the Company’s EPS at 70% and the Company’s ROE at 30%. The payout of performance-based LTI compensation by level is as follows:• Ifthresholdlevel is achieved, a named executive officer can receive 40% of the target level. No awards are made if threshold is not met.• Iftargetlevel is achieved, a named executive officer can receive 100% of his LTI compensation target.• Ifmaximumlevel is achieved, a named executive officer can receive up to 200% of his LTI compensation target.The actual amount of performance-based LTI compensation awarded is commensurate with the EPS and ROE achievements and proportionate to the performance achieved between threshold level and maximum level.For awards of performance-based restricted stock toperiod will be made in 2011,2012). During the same meeting, the HR Committee approved settingalso established performance metrics for the financial goals at 70% of the weighting relating to the Company’s EPS and 30% of the weighting relating to the Company’s ROE based on a combination of the most recent 2008 budget andmulti-year business plan. The equity grants to2010-2012 performance period (grants earned for this period will be made in 2011 will still be based on a three-year period. However, the calculation of the payouts has been simplified by establishing stand-alone formulas for EPS and ROE. The EPS and ROE financial goals will be considered individually. The amount a named executive officer receives is contingent upon achievement of levels, as follows:• Ifthresholdlevel of EPS performance is achieved, a named executive officer can receive 40% of the 70% portion of LTI compensation target.• Ifthresholdlevel of ROE performance is achieved, a named executive officer can receive 40% of the 30% portion of LTI compensation target.• Iftargetlevel of EPS performance is achieved, a named executive officer can receive 100% of the 70% portion of LTI compensation target.• Iftargetlevel of ROE performance is achieved, a named executive officer can receive 100% of the 30% portion of LTI compensation target.• Ifmaximumlevel is achieved, a named executive officer can receive up to 200% of his LTI compensation target.The actual amount of performance-based LTI compensation awarded is commensurate with the EPS and ROE achievements and proportionate to the performance achieved between threshold level and maximum level. Due to the uncertain global economic conditions, the 2012 long term incentive target levels for performance-based restricted stock were not set and when established, will be based on a performance period that would qualify for tax deductibility under Code Section 162(m)2013). The performance period will be considered at a future HR Committee meeting.2008 Performance-Based Restricted Stock GrantsOn May 5, 2008,metrics the HR Committee metestablished for both periods are (i) cumulative Company return on equity (“ROE”), (ii) cumulative net income, (iii) cumulative revenue from acquisitions or organic growth, and (iv) the Company’s credit rating. Each of these metrics cultivates management concentration on performance improvements linked to considerlong-term stockholder value. Taken together, these metrics compel management to address growth and approve the long term performance-based grants. Forinvestment relative to risk and liquidity. The performance above or below the performance target range the number of shares is increased or reduced respectively. Since the Company achieved the maximum level, management recommended to the HR Committee and the HR Committee approved granting awards that were two-times (200%) the performance-based LTI target. The HR Committee noted that because the maximum goals were achieved, the awards represented fair long term incentive23compensationlevels for the named executive officers. See the “Grants of Plan-Based Awards” table for awards granted in 2008. The calculation of the 2008 long term performance-based grant is set forth below: Over %Target % Earned Payout% Actual Target Target Earned Over Target per Metric Earnings Per Share $6.55 $3.82 $2.73 100% 95.29% 195.29% Return on Equity 18.31% 11.30% 7.01% 100% 123.98% 223.98% Payout = 200% In 2005, the HR Committee adopted a formula to determine the number of shares to be granted for the performance-based grants and time-based grants since the threshold, target, and maximum amounts are set as a percentage of base salary. The formula uses the one-year average stock price for the one-year period ended March 31 of the year of the grant to determine the number of shares of restricted stock to be awarded. For the performance-based grants and time-based grants made on May 5, 2008, the one-year average stock price of $35.44 per share was used for our named executive officers.Total Compensation Target LevelsTotal compensation target level is the sum of base salary, AIC target level, and LTI compensation target level. The results of the benchmarking study showed that the 2007 total compensation target levels were below the 50th percentile for each of the named executive officers. The HR Committee approved changes to compensation as previously disclosed in this proxy statement for 2008. The result was that the total compensation target level for each of theall named executive officers remained below the 50th percentile.2009 CompensationIn March 2008, the HR Committee retained the services of Hewitt as its compensation consultant for the remainder of 2008.The Board of Directors, upon the recommendation of the executives and the HR Committee, did not increase the base salaries for the named executive officers. This is the third year in a row that Mr. Wallace has recommended his base salary remain fixed. The HR Committee and the Board of Directors believe this action was appropriate in light of the uncertainty of the global economy.The Board of Directors, upon the recommendation of the HR Committee, determined that commencing with the 2009 Annual Incentive Program, the EPIP performance goal and payout level will be eliminated.Additionally, the Board of Directors, upon the recommendation of the HR Committee, did not increase the AIC levels for the named executive officers, other than Mr. McWhirter. The Board of Directors increased Mr. McWhirter’s AIC target to 75% (from 60%) and his AIC maximum to 150% (from 120%) in order to adjust his total target cash compensation closerrespect to the 50th percentile. This adjustment resultedfour metrics are shown in his incentive target cash moving from 19% below the 50th percentileTable 7.2% above the 50th percentile based on 2009 compensation market data. Additionally, the AIC target increase for Mr. McWhirter aligned his total target cash competitive position to 5% below the 50th percentile from 13% below based on 2009 compensation market data.The HR Committee established the 2009 AIC measurement as Company EPS, setting threshold at $1.00 EPS and target at $1.80 EPS. This performance goal range reflects the appropriate potential challenges and opportunities associated with the Company’s 2009 budget. In addition, to encourage management to stretch for significant cash flow improvement versus the 2009 Free Cash Flow benchmark, an additional component, Free Cash Flow, will be included as an enhancement to the short term incentive plan to create a special emphasis on generating cash flow. For purposes of the performance goal, Free Cash Flow is defined as the net cash provided by operating activities, less the net cash required by investing activities, as reflected in the Company’s audited financial statements to be reported in the Company’s 2009Form 10-K. One-half of any amount above the 2009 Free Cash Flow benchmark of $281 million will be converted to fully diluted earnings per share amount and will result in an adjustment to incentive payout amounts contingent on the attainment of threshold EPS goal. The Company notesnote that the24performance goals are part of the Company’s incentive program and do not correspond to any financial guidance that the Company has provided to the investment community for 2009 or that the Company will provide for future years and should, therefore, not be considered as statements of the Company’s expectations or estimates.Grant Periods Threshold Target Maximum Threshold Target Maximum Threshold Target Maximum Threshold Target Maximum 2012 5.0% 8.0% 15% $75 M $125 M $200 M $150 M $250 M $400 M BB BB+ BBB- 2013 8.0% 12.0% 20% $150 M $200 M $300 M $250 M $375 M $600 M BB BB+ BBB- (1) See the “Grants of Plan-Based Awards Table”information on future possible payments to the named executive officers.With respect to LTI, Hewitt’s study concluded that, while total target compensation for the named executive officers is generally within a competitive range, overall LTI targets for the named executive officers are below the market median. Hewitt recommended that the mix of pay between target cash compensation and long term compensation should be rebalanced. To rebalance the mix in pay, the Board of Directors increased the LTI target percentage for Mr. Wallace from 275% to 300%, from 150% to 175% for Messrs. McWhirter, Stiles, and Menzies and from 100% to 125% for Mr. Rice. The LTI target adjustments will not take effect until 2012 due to the Company’s method of calculating performance-based long term incentives to comply with the provisions of Section 162(m) of the Code.P.B. Unit Program $ 3.00 $ 4.00 $ 6.00 $ 6.50 $ 7.50 $ 9.00 Internal Equity Regarding CEO CompensationThe HR Committee follows the same processes and methods disclosed herein in establishing the compensation for all other named executive officers as it does in recommending to the independent directors the compensation package for Mr. Wallace. As noted previously, his position as Chairman of the Board, Chief Executive Officer, and President is compared to other executives in comparable positions in the comparator group and surveys previously disclosed in this proxy statement. Since as the Chairman, Chief Executive Officer, and President of the Company, he has a unique and greater set of responsibilities as compared to the other named executive officers, including having the ultimate responsibility for the overall success of the Company, the Board of Directors does not consider his compensation to be comparable to the compensation of the other named executive officers.Recoupment on RestatementThe Board of Directors has adopted a Company policy that allows payouts to be ratably recouped under annualand/or long term incentive plans if the financial statements on which they are based are subsequently required to be restated as a result of errors, omissions, fraud or other misconduct. The policy provides discretion to the HR Committee to make such determinations while providing a framework to guide their decisions.Post-employment Benefits No new participants have been added to the Standard Pension Plan since it was frozen.deferredtransition compensation plans consist of the following:• Trinity Industries, Inc. Standard Pension Plan (the “Standard Pension Plan”) — a funded, tax qualified, non-contributory defined benefit pension plan that covers certain of our employees, including the named executive officers. Earnings are capped by the Code for those defined as “highly compensated employees.”Plan. This amendment is designedPlan to reduce future pension costs and provides that,costs. Under this Amendment, effective March 31, 2009, all future benefit accruals under the Standard Pension Plan automatically ceased for all participants, and the accrued benefits under the Standarddoesdid not affect other benefits earned by participants prior to March 31, 2009.• Trinity Industries, Inc. Supplemental Retirement Plan (the “Supplemental Retirement Plan”) — a non-qualified plan that provides annual retirement benefits that are not provided under the Standard Pension Plan because of Code limitations. Several years ago the Board of Directors made the decision to discontinue adding executives to this plan. Mr. Wallace was a participant at the time and was grandfathered. As a result, Mr. Wallace is the only named executive officer that participates in the Supplemental Retirement Plan.25Trinity Industries, Inc. Supplemental Retirement Plan (the “Supplemental Retirement Plan”) — a non-qualified plan that provides annual retirement benefits that are not provided under the Standard Pension Plan because of Code limitations. Several years ago the Board of Directors made the decision to discontinue adding executives to this plan. Mr. Wallace was a participant at the time and was grandfathered. As a result, Mr. Wallace is the only current employee who participates in the Supplemental Retirement Plan. In addition to Mr. Wallace, certain retired employees, or their spouses, participate in the Supplemental Retirement Plan. On February 13, 2009, the Board amended the Supplemental Retirement Plan designed to reduce future retirement plan costs. This amendment providesprovided that all future benefit accruals under the Supplemental Retirement Plan automatically ceased effective March 31, 2009 and the accrued benefits under the Supplemental Retirement Plan were determined and frozen as of that date, including Mr. Wallace’s benefits.• Trinity Industries, Inc. Profit Sharing 401(k) Plan (the “401(k) Plan”) — a voluntary, tax qualified, defined contribution plan that covers most of our employees, including the named executive officers, that includes a Company match for a portion of the employee’s contribution. commencing with the 2009 Plan year to (i) allow the participants in the Standard Pension Plan to participate in the enhanced portion of the 401(k) Plan whichthat provides for potential annual contributions by the Company to the participating employee’s account of up to an additional 3% of an employee’s base pay, (subjectsubject to the Code limit for 401(k) plans, ($245,000 in 2009)) depending upon years of service (the “Annual Retirement Contribution”) and (ii) require Board approval for the Company to make the 401(k) Company match and the Annual Retirement Contribution. • (i)Trinity Industries, Inc. Supplemental Profit Sharing Plan (the “Supplemental Plan”) — a supplemental deferred profit sharing plan for highly compensated employees that allows themdefer a portiontransition out of their base payhis or her position and annual incentivemust work with the Chief Executive Officer to develop and includes a Company match for a portionimplement an agreed-on succession process to facilitate the smooth transition of their contribution.the participant’s duties and responsibilities to his or her successor. • (ii)2005 Deferred Compensation PlanAgreement (the “Deferred Compensation Plan”) — a plan to encourage the retention of strategically important executives focused on continuous improvement and growthfinancial affairs of the Company, at the Company’s reasonable request and for mutually-agreed upon compensation.(iii) recognition of their contribution toa material manner with the Company, and inwithout the caseprior written consent of Messrs. McWhirter, Stiles, Menzies, and Rice to provide benefits on retirement in lieuthe Chief Executive Officer or the Chairman of participation in the Supplemental Retirement Plan. Mr. Rice was added to the plan in 2008.HR Committee.We considerThe Company considers the compensation that would be payable under the agreement upon termination following a change in control to be appropriate in light of the unique mix of the industries we arein which it is engaged, in, the limited number of companies in many of those industries, and the uncertain length of time necessary to find new employment. The level of payments and benefits provided under the change in control agreements wereare considered appropriate. These benefits are recognized as part of the overalltotal compensation package and are reviewed periodically, but are not specifically considered by the HR Committee when making changes in base salary, AIC,annual incentive compensation, or LTIlong-term incentive compensation. During 2008, the HR Committee reviewed the change in control severance benefits of the named executive officers in connection with a more comprehensive review of the overall change in control severance policy in general and made modifications to comply with Section 409A of the Code. The change in control severance benefits are discussed in the Executive Compensation section under “Potential Payments Upon Termination or Change in Control.” The Company does not have severance agreements with named executive officers other than in connection with the change in control agreements.long termlong-term disability plan, and employee-paid dental, vision, cancer-specific insurance, and optional life insurance are substantially similar for the named executive officers as for all full-time employees.26
Compensation-Related Policies and PositionsThe HR Committee follows the same processes and methods disclosed herein to establish the compensation for all other named executive officers as it does in recommending to the independent directors the compensation package for Mr. Wallace. As noted previously, his position as Chairman, Chief Executive Officer, and President is compared to other executives in comparable positions in the peer group and surveys previously disclosed in this proxy statement. Since as the Chairman, Chief Executive Officer, and President of the Company, he has a unique and greater set of responsibilities as compared to the other named executive officers, including having the ultimate responsibility for the overall success of the Company, the Board of Directors does not consider his compensation to be comparable to the compensation of the other named executive officers. It is important to note that for several years, Mr. Wallace has told the HR Committee and the Board of Directors he believes he is adequately compensated. In deference to his request, the Board has kept his base salary fixed for the last six years at the current level.publicly heldpublicly-held corporation, Section 162(m) of the Code limits the federal income tax deduction for the compensation of certain executive officers that exceeds $1 million per year. “Performance-based” compensation is not subject to the limitations on deductibility and the HR Committee strives to structure compensation so as to qualify for deductibility. The HR Committee will continue to monitor future deductibility options. However, the HR Committee may authorize compensation that may not be deductible when it deems doing so to be in the best interest of the Company and its stockholders.Stock Ownership GuidelinesConclusionStock ownership guidelines have been adopted that require the CEO to maintain ownership of Company stock valued at five times base salary, the other named executive officers at three times base salary, and the Board of Directors at three times annual retainer. Stock ownership is defined as stock owned without restrictions; restricted shares that vest at retirement; shares or share equivalents held in a qualified or non-qualified profit sharing plan; shares or units granted on which restrictions remain; and equivalent shares determined from vested, in-the-money stock options. The named executive officers and the directors are all in compliance with the guidelines.Conclusionconcurrent preservation of, and improvements to, the Company’s financial condition, thereby clearly aligning each executive’s potential compensation with the long-term interests of stockholders. In summary, the Company’s executive compensation programs contribute to a high-performance culture where executives are expected to deliver results that promote the Company’s position as a premier, multi-industry company.officer compensation program providesprograms provide appropriate incentives to each executive officersofficer to achieve strong financial performance and aligns with stockholder interests. The compensation philosophy and programs outlined above continue to direct the efforts of our executive officers in drivingstrive for the Company’s future growthachievement of outstanding operating results and success.Human Resources Committee ReportHuman Resources CommitteeRonald W. Haddock,ChairmanLeldon E. EcholsRonald J. GaffordJess T. HayDiana S. Natalicio27Human Resources Committee Ronald J. Gafford,Chairman Rhys J. Best Leldon E. Echols Charles W. Matthews Diana S. Natalicio Douglas L. Rock Compensation of Executivesprogram.programs.2009. The compensation for Mr. Perry for 2009 is not shown because he was not a named executive officer for that year.2008, 2007,2011, 2010, and 2006.Summary Compensation Table Change in Pension Value and Nonqualified Non-Equity Deferred Stock Option Incentive Plan Compensation All Other Name and Salary Awards Awards Compensation Earnings Compensation Total Principal Position Year ($)(1) ($)(2) ($)(2) ($)(3) ($)(4) ($)(5) ($) Timothy R. Wallace 2008 $ 950,000 $ 4,096,782 $ 290,105 $ 1,671,136 $ 1,077,123 $ 452,718 $ 8,537,864 Chairman, Chief Executive 2007 950,000 3,800,846 399,457 2,141,818 732,431 520,537 8,545,089 Officer, and President 2006 950,000 2,378,140 399,457 2,343,365 840,175 521,742 7,432,879 William A. McWhirter 2008 425,000 858,340 57,097 498,409 33,512 149,637 2,021,995 Senior Vice President and 2007 425,000 840,133 74,344 703,182 3,914 169,056 2,215,629 Chief Financial Officer 2006 370,000 528,583 74,344 616,679 8,606 143,707 1,741,919 Mark W. Stiles 2008 520,000 984,504 96,126 609,818 66,181 176,148 2,452,777 Senior Vice President 2007 520,000 1,022,833 113,951 860,364 24,339 200,144 2,741,631 and Group President 2006 490,000 678,950 113,951 816,683 26,655 189,027 2,315,266 D. Stephen Menzies 2008 520,000 878,980 61,909 609,818 29,562 250,177 2,350,446 Senior Vice President 2007 520,000 900,756 89,095 860,364 13,895 273,572 2,657,682 and Group President 2006 482,500 530,055 89,095 804,183 12,109 218,548 2,136,490 S. Theis Rice 2008 365,000 375,006 27,182 313,154 45,000 108,467 1,233,809 Vice President and 2007 350,000 413,540 30,414 465,341 14,000 38,950 1,312,245 Chief Legal Officer 2006 300,000 239,911 30,414 440,010 19,000 33,435 1,062,770 Year
Chairman, Chief Executive
Officer, and President 2011 $ 950,000 $ — $ 3,415,985 $ 1,900,000 $ 944,195 $ 394,656 $ 7,604,836 2010 950,000 — 1,973,580 559,170 736,571 280,804 4,500,125 2009 950,000 — 1,254,400 940,500 735,432 361,428 4,241,760
Senior Vice President and
Chief Financial Officer 2011 350,000 50,000 2,347,275 525,000 178 133,576 3,406,029 2010 296,667 20,000 444,500 101,861 — 65,728 928,756
Senior Vice President
and Group President 2011 540,000 — 1,220,924 810,000 23,007 190,200 2,784,131 2010 520,000 — 698,500 204,048 16,253 126,105 1,564,906 2009 520,000 — 504,896 343,200 38,557 188,948 1,595,601
Senior Vice President and
Group President 2011 450,000 50,000 1,046,682 675,000 42,133 168,206 2,432,021 2010 425,000 — 698,500 208,463 26,845 119,058 1,477,866 2009 425,000 — 470,400 350,625 30,066 144,113 1,420,204
Senior Vice President, Human
Resources and Chief Legal Officer 2011 400,000 — 949,861 600,000 43,169 141,479 2,134,509 2010 365,000 — 304,800 104,436 35,429 83,494 893,159 2009 365,000 — 285,376 175,656 37,320 99,741 963,093 (1) Stiles, $41,800; $18,700;Rice, $30,638; $11,287; $14,513; and $11,440,$4,300, respectively, of the above amount was deferred pursuant to the Supplemental Plan and also is reported in the “Nonqualified Deferred Compensation Table.”(2) (3) Stock and optionrecognized for financial statement reporting purposes with respect to the fiscal yearcomputed in accordance with SFAS 123R and include awards granted in prior periods. OurASC Topic 718. The policy and assumptions made in the valuation of share-based payments are contained in Note 1716 of Item 8 of the Annual Report onForm 10-K for the year-ended December 31, 2008.2011.(3)(4)20082011 under the 20082011 Annual Incentive Program based on goal achievements, (ii) during 2010 under the 2010 Annual Incentive Program based on goal achievements and (iii) during 2009 under the 2009 Annual Incentive Program based on goal achievements. For 2011, for Mr. Wallace $83,557$57,000 and for Mr. Stiles $12,196Perry $15,750 of the above amount was deferred pursuant to the Supplemental Plan and is also reported in the “Nonqualified Deferred Compensation Table.”(4)(5)$1,050,000for 2011, $932,000 of this column represents the aggregate change in pension values during 2008the 2011 fiscal year under the Standard Pension Plan and the$27,123$5,571 represents Mr. Wallace’s above market earnings on nonqualified deferred compensation under the Company’s DeferredTransition Compensation Plan. For 2010 for Messrs. Menzies, McWhirter, Stiles, Menzies, and Rice, the change in pension values werewas $14,000; $25,000; $55,000; $19,000; and $45,000,$35,000, respectively, under the Standard Pension Plan and the above market earnings on nonqualified deferred compensation under the DeferredTransition Compensation Plan were $8,512; $11,181; $10,562;$2,253; $1,845; and $0,$429, respectively. For Mr. Wallace’sWallace for 2009, $729,000 of this column represents the aggregate change in pension plan reflects a correction ofvalues during 2009 fiscal year under the calculation of the 2006Standard Pension Plan and 2007 change in pension plan data due to a miscalculation of pensionable wages under the Supplemental Retirement Plan, and $6,432 represents Mr. Wallace’s above market earnings on nonqualified deferred compensation under the Company’s Transition Compensation Plan. For 2009 for Messrs. Menzies, McWhirter, and Rice, the change in 2006.pension values was $36,000; $28,000; and $37,000, respectively, under the Standard Pension Plan and the above market earnings on nonqualified deferred compensation under the Transition Compensation Plan were $2,557; $2,066; and $320, respectively.(5)(6)28All Other Compensation Company Perquisites Contributions Executive and Other to Defined Deferred Total All Perquisite Personal Contribution Compensation Other Name Year Plan(1) Benefits(2) Plans(3) Plan(4) Compensation Timothy R. Wallace 2008 $ 95,000 $ — $ 95,604 $ 262,114 $ 452,718 2007 95,000 32,483 83,872 309,182 520,537 2006 95,000 19,301 78,104 329,337 521,742 William A. McWhirter 2008 42,500 — 14,796 92,341 149,637 2007 42,500 — 13,738 112,818 169,056 2006 37,000 — 8,039 98,668 143,707 Mark W. Stiles 2008 52,000 — 11,166 112,982 176,148 2007 52,000 — 10,108 138,036 200,144 2006 49,000 — 9,359 130,668 189,027 D. Stephen Menzies 2008 52,000 78,295 6,900 112,982 250,177 2007 52,000 42,251 41,285 138,036 273,572 2006 48,250 37,661 3,969 128,668 218,548 S. Theis Rice 2008 36,500 — 4,152 67,815 108,467 2007 35,000 — 3,950 — 38,950 2006 30,000 — 3,435 — 33,435 Name Year
Perquisite 2011 $ 71,250 $ — $ 38,406 $ 285,000 $ 394,656 2010 71,250 — 58,637 150,917 280,804 2009 95,000 — 77,378 189,050 361,428 2011 26,250 — 19,826 87,500 133,576 2010 22,250 — 15,916 27,562 65,728 2011 40,500 — 14,700 135,000 190,200 2010 39,000 — 14,700 72,405 126,105 2009 52,000 36,418 14,210 86,320 188,948 2011 33,750 — 21,956 112,500 168,206 2010 31,875 — 23,837 63,346 119,058 2009 42,500 — 24,050 77,563 144,113 2011 30,000 — 11,479 100,000 141,479 2010 27,375 — 9,175 46,944 83,494 2009 36,500 — 9,175 54,066 99,741 (1) Perquisites Plan for the annual perquisite allowance.Perquisite Allowance.(2) For 2008includes $67,001in 2009 are for reimbursement of commuting expenses including thea gross up for federal taxes of $24,422, $10,354 forand personal use of the Company’s aircraft, and the remainder is for automobile maintenance service and incidental items received in connection with attendance at a Board of Directors meeting. Mr. Menzies’s commuting expenses in 2008 and 2009 are subject to reimbursement by the Company up to $50,000 per year and a gross up for federal taxes. After 2009, the Company will not provide any reimbursement to Mr. Menzies for commuting expenses. The amounts reported for personal use of Company aircraft represent the incremental cost of providing the benefit and include the cost of fuel, catering, landing fees, flight crew expenses, “dead head” costs of flying aircraft to and from locations for personal use, and the dollar value of the lost tax deductions for expenses that exceed the amounts reported as income for the named executive officers.aircraft.(3) 20082011 for Messrs. Wallace $5,446; $14,700; Perry $12,654; Menzies $14,700;$5,446; Stiles $5,446; Menzies $6,900;$14,700; and Rice $4,152$9,329 and under the Company’s Supplemental Plan for 20082011 for Messrs. Wallace $90,158;$23,706; Perry $7,172; McWhirter $9,350;$7,256; and Stiles $5,720.Rice $2,150.(4) DeferredTransition Compensation Plan. These amounts also are included in the “Nonqualified Deferred Compensation Table.” The DeferredEach named executive officer participates in the Transition Compensation Plan which is discussedan unfunded long term plan whereby an amount equal to 10% of salary and annual incentive compensation is set aside in an account on the books of the Company. The account is credited monthly with an interest rate equivalent as determined annually by the HR Committee (5% for 2011). The account is payable to the participant in a lump sum or annual installments from one to 20 years, subject to compliance with the following that table.conditions:29(i) (ii) (iii) Grants of Plan-Based Awards20082011 grants of equity and non-equity plan-based awards for the named executive officers and the 20092012 grants of non-equity plan-based awards for the named executive officers.Grants of Plan-Based Awards Table All Other All Other Estimated Possible Payouts and Estimated Future Payouts Stock Awards Option Awards Grant Date Future Payouts Under Under Equity Incentive Number of Number of Exercise or Fair Value Non-Equity Incentive Plan Awards(2) Plan Awards(3) Shares of Securities Base Price of Stock Stock or Underlying of Option and Option Grant Threshold Target Maximum Threshold Target Maximum Awards Options Awards Awards Name Date(1) ($) ($) ($) ($) ($) ($) ($)(4) ($) ($) ($)(5) Timothy R. Wallace 2008 Annual Incentive Plan $ 427,500 $ 855,000 $ 2,280,000 2008 Equity Awards 05/05/08 88,500 — $ 2,918,730 2008 Equity Awards 12/10/08 85,000 $ 16.24 395,055 2009 Annual Incentive Plan 513,000 855,000 1,710,000 2011 Equity Awards $ 783,750 $ 1,959,375 $ 3,918,750 $ 3,918,750 William A. McWhirter 2008 Annual Incentive Plan 127,500 255,000 765,000 2008 Equity Awards 01/14/08 15,000 371,250 2008 Equity Awards 05/05/08 18,800 2,800 712,368 2008 Equity Awards 12/10/08 40,000 16.24 185,908 2009 Annual Incentive Plan 191,250 318,750 637,500 2011 Equity Awards $ 191,250 $ 478,125 $ 956,250 $ 956,250 Mark W. Stiles 2008 Annual Incentive Plan 156,000 312,000 936,000 2008 Equity Awards 05/05/08 24,900 1,500 870,672 2008 Equity Awards 12/10/08 45,000 16.24 209,147 2009 Annual Incentive Plan 187,200 312,000 624,000 2011 Equity Awards $ 234,000 $ 585,000 $ 1,170,000 $ 1,170,000 D. Stephen Menzies 2008 Annual Incentive Plan 156,000 312,000 936,000 2008 Equity Awards 05/05/08 21,300 5,100 870,672 2008 Equity Awards 12/10/08 45,000 16.24 209,147 2009 Annual Incentive Plan 187,200 312,000 624,000 2011 Equity Awards $ 234,000 $ 585,000 $ 1,170,000 $ 1,170,000 S. Theis Rice 2008 Annual Incentive Plan 91,250 182,500 538,375 2008 Equity Awards 05/05/08 10,200 336,396 2008 Equity Awards 12/10/08 25,000 16.24 116,193 2009 Annual Incentive Plan 95,813 182,500 319,375 2011 Equity Awards $ 109,500 $ 273,750 $ 547,500 $ 547,500 Name $ 380,000 $ 950,000 $ 1,900,000 05/02/11 29,213 97,377 194,754 $ 3,415,985 380,000 950,000 1,900,000 105,000 262,500 525,000 03/02/11 20,000 600,800 05/02/11 5,795 19,318 38,636 5,000 853,075 12/07/11 30,000 893,400 127,500 318,750 637,500 162,000 405,000 810,000 05/02/11 8,941 29,804 59,608 5,000 1,220,924 166,800 417,000 834,000 135,000 337,500 675,000 05/02/11 7,451 24,837 49,674 5,000 1,046,682 144,000 360,000 720,000 120,000 300,000 600,000 05/02/11 6,623 22,077 44,154 5,000 949,861 124,800 312,000 624,000 (1) and option awards is the date of the HR Committee meeting or Board meeting at which such award was approved.(2) 20092012 under the 20082011 Annual Incentive Program for attainment of performance goals and potential amounts payable in 20102013 under the 20092012 Annual Incentive Program for attainment of performance goals. For 2008, maximum represents the EPIP level as described under “Compensation Discussion and Analysis — Establishing Annual Incentive Payout Levels.” There is no EPIP level for 2009.30one trip.(3) 20082011 equity awards, represents the number of performance-based restricted sharesstock units that were awarded in May 20082011 to each of the named executive officers as performance-based awards based on achieving financial performance for 20062011 through 2013. These units are earned and 2007 above the maximum level. These shares vest as discussed below. For 2011, represents the threshold, target, and maximum value of performance-based shares that could be awarded in 2011 if threshold, target, or maximum financial performance goals are achieved for the cumulative performance period2008-2010. The actual number of shares to be issued in 2011 will be based on the value of the award to be granted in 2011 divided by the one-year average stock price for the period ended March 31, 2011.(4) In January 2008, upon the successful completion of Mr. McWhirter’s third year as the Company’s CFO, the HR Committee made a special award of 15,000 restricted shares. These shares vest on the earlier of (i) age 65, (ii) when Mr. McWhirter’s age plus years of service equal 80, (iii) death, disability, or change in control or (iv) consent of the HR Committee after three years from the date of the grant. The HR Committee granted the shares to increase Mr. McWhirter’s equity ownership and to recognize his contributions to the Company during his third year as CFO. 20082011 to Messrs. Perry, Menzies, McWhirter, Stiles, and Menzies in the amounts of 2,800, 1,500, and 5,100 shares, respectively wereRice was granted as time-basedretention-based awards and vestvests as described below.(5) and option awards is calculated in accordance with SFAS 123R, except as it relates to the 2011 equity awards which have been included at the maximum potential value.ASC Topic 718.Discussion Regarding Summary Compensation Table and Grants of Plan-Based Awards Table awards and the option awards described in the “Summary Compensation Table” are the dollar amounts reflectedof the grant date fair value of the awards calculated in our financial statements for 2006, 2007, and 2008 and includeaccordance with ASC Topic 718.made in prior periods.The stock awardsgranted in May 20082011 to the named executive officers, other than Mr. Wallace (whose grant was solely of performance-based restricted stock units), were grants of (i) performance-based restricted stock units and (ii) retention-based restricted stock, all granted pursuant to ourthe Amended and Restated 2004 Stock Option and Incentive Plan thatPlan.fivethe full performance period. In the event of a change of control of the Company, the performance metrics will be assumed to have been met at target level and the recipients will earn the target grant of units. In the event of retirement or termination without cause prior to the third anniversary of the date of grant, the number of performance-based restricted stock units earned will be based on the level of achievement for the entire performance period, multiplied by a fraction, the numerator of which is the number of days from the date of grant to the date of retirement or termination without cause, and the denominator of which is the number of days in the full performance period. However, in the event of such a retirement or termination without cause, all units earned (and shares payable with respect thereto) are subject to forfeiture, at the discretion of the HR Committee, if the recipient of the grant is affiliated in certain respects with a competitor, customer, or supplier of the Company.on May 15,th following the first anniversary of the grant or 2015. All awards granted in 2011 vest earlier upon death, disability, or a change in control or consent of the HR Committee after three years from the date of grant. The awards are forfeited if termination of employment occurs prior to vesting. The recipients of the retention-based restricted stock are entitled to dividends and to vote the shares of Common Stock during the restricted period. Recipients of performance-based restricted stock awards were made as long term compensation based on aggregate achievement ofunits do not receive dividends or vote with respect to the Company’s 2006units during the performance period. See the description in “Long Term Incentive Compensation” under “Compensation Discussion and 2007 financial performance of diluted earnings per share of $2.90 and $3.65 respectively and return on equity of 17.84% and 18.77% respectively as well as the HR Committee’s evaluation of each executive’s overall performance during 2007.Analysis.”20082011 to the named executive officers were pursuant to our 2008 Annual Incentive Program and represented performance goal achievement based on the Company’s 2008Company EPS of $3.59.$1.65, reflecting an adjustment by the HR Committee to remove the effects of a gain from insurance proceeds net of insurance deductibles.20092012 Annual Incentive Program represent potential payments of annual incentive compensation for 2009.2012. The HR Committee established the annual incentive performance goals for 20092012 based on earnings per share. To achieve target, the Company must earn EPS of $1.80$2.45 for 2009.2012. See “Setting 2012 Annual Incentive Compensation Performance Levels” under “Compensation Discussion and Analysis” above for a description of the goals.PlanAllowance that in 20082011 provided to the named executive officers an allowance of 10%7.5% of base paysalary in lieu of providing company furnished vehicles,traditional benefits for executives such as club memberships, automobile allowances, and similar perquisites.fees and expenses incurred in financial planning and income tax preparation. Other than being required to use $6,000 of the perquisite allowance to maintain a four-door sedan, including insurance and other maintenance, and to forego reimbursement for the first 10,000 business miles annually, the perquisite allowance is to be used at the discretion of the executive for perquisite type expenses. It is intended that the perquisite allowance will eliminate charges to the Company for personal benefits for the executives that are not provided to Company employees generally other than occasionalde minimisitems such as the use of Company tickets to entertainment events or expenses related to spousal travel. The perquisite allowance is not intended to cover personal use of the Company’s aircraft or commuting or relocation expenses. For security purposes, the Board requires the CEO to use the Company aircraft for personal travel to the extent possible, and the value attributed to such personal use is calculated using the aggregate incremental cost method set forth in Note (2)method. Incremental costs include the cost of fuel, catering, landing fees, flight crew expenses, “dead head” costs of flying aircraft to “Alland from locations for personal use, and the dollar value of the lost tax deductions for expenses that exceed the amounts reported as income for the named executive officers. Other Compensation.” During 2008, Mr. Wallace did notnamed executive officers may have periodic personal travel which required the use of the Company-ownedCompany aircraft. TheDuring 2011, Mr. Wallace and Mr. Perry each had personal use of Company has been paying commuting expensesaircraft for Mr. Menzies between Chicago, Illinois and Dallas, Texas. Mr. Menzies’s commuting expenses in 2008 and 2009 are subject to reimbursement by the Company31up to $50,000 per year and a gross up for federal taxes. After 2009, the Company will not provide any reimbursement to Mr. Menzies for commuting expenses.The Company has a 401(k) planPlan that permits employees to elect to set aside up to 14% of their compensation (subject to the maximum limit on the amount of compensation permitted by the Code to be deferred for this purpose) in a trust to pay future retirement benefits. Depending upon years of service, the Company may match up to 50% of no more than 6% of the employee’s compensation set aside for this purpose. For employees who participate in the enhancement to the 401(k) plan,Plan, the Company contributes up to an additional 3% of the employee’s base paysalary (subject to the maximum limit permitted by the Code) depending upon years of service to the account of employees participating in the enhanced portion of the 401(k) planPlan as an Annual Retirement Contribution. No named executive officers participated in the enhanced portion of the 401(k) plan during 2008. As a result of the amendment to the Standard Pension Plan adopted on February 13, 2009, the named executive officers’ accrued benefits were frozen and no future benefits will accrue under the Standard Pension Plan. Therefore, commencing with the 401(k) plan’sPlan’s 2009 plan year, all of the named executive officers will bewere eligible to participate in the enhanced portion of the 401(k) plan.Plan. Matching contributions under the Supplemental Plan are discussed under “Nonqualified Deferred Compensation.”an increasethe passage of time and changes in the five year average compensation under the Supplemental Retirement Plan created by elimination of a year of low annual incentive compensation during a down cycle period.actuarial assumptions.executive perquisite allowance,Executive Perquisite Allowance, and annual incentive compensation in 20082011 represented from 35%27% to 65%50% of the named executive officers’ total compensation as reflected in the “Summary Compensation Table.”32Outstanding Equity Awards at Year-End2008,2011, for each named executive officer, the number of unexercised options and the number of shares of unvested restricted stock. The market value of the stock awards was based on the closing price of the common stockCommon Stock as of December 31, 2008,30, 2011, which was $15.76.$30.06. Option Awards Stock Awards Equity Incentive Equity Plan Awards: Incentive Market or Plan Awards: Payout Number of Number of Market Number of Value of Securities Securities Number of Value of Unearned Unearned Underlying Underlying Shares or Shares or Shares, Units Shares, Units Unexercised Unexercised Units of Units of or Other or Other Options Options Option Stock That Stock That Rights That Rights That (#) (#) Exercise Option Have Not Have Not Have Not Have Not Price Expiration Vested Vested Vested Vested Name Exercisable Unexercisable(1) ($) Date (#)(2) ($) ($) ($) Timothy R. Wallace — 20,550 18.94 05/10/14 475,282 $ 7,490,444 $ 783,750 (3) $ 783,750 (3) — 17,700 17.94 05/09/15 783,750 (4) 783,750 (4) — 85,000 16.24 12/10/18 William A. McWhirter — 4,500 18.94 05/10/14 161,658 2,547,730 191,250 (3) 191,250 (3) — 7,200 17.94 05/09/15 191,250 (4) 191,250 (4) — 40,000 16.24 12/10/18 Mark W. Stiles 1,377 — 11.33 05/29/13 168,650 2,657,924 234,000 (3) 234,000 (3) 5,610 5,610 18.94 05/10/14 234,000 (4) 234,000 (4) 5,055 10,110 17.94 05/09/15 — 45,000 16.24 12/10/18 D. Stephen Menzies — 4,680 18.94 05/10/14 132,900 2,094,504 234,000 (3) 234,000 (3) — 8,610 17.94 05/09/15 234,000 (4) 234,000 (4) — 45,000 16.24 12/10/18 S. Theis Rice 6,000 — 11.33 05/29/13 64,491 1,016,378 105,000 (3) 105,000 (3) 3,300 1,650 18.94 05/10/14 109,500 (4) 109,500 (4) 4,080 4,080 17.94 05/09/15 — 25,000 16.24 12/10/18 Name Option Awards Stock Awards Exercisable Unexercisable(1) — 85,000 $ 16.24 12/10/18 321,227 $ 9,656,084 (3) $ 2,175,975 (3) — — (4) 1,496,250 (4) 97,377(5) 3,415,985 (5) — 12,500 16.24 12/10/18 97,010 2,916,121 (3) 272,951 (3) (4) 187,688 (4) 19,318(5) 677,675 (5) 4,680 — 18.94 05/10/14 96,130 2,889,668 (3) 694,785 (3) 8,610 — 17.94 05/09/15 (4) 477,750 (4) — 45,000 16.24 12/10/18 29,804(5) 1,045,524 (5) 2,778 — 17.94 05/09/15 138,781 4,171,757 (3) 567,853 (3) — 40,000 16.24 12/10/18 (4) 390,469 (4) 24,837(5) 871,282 (5) — 25,000 16.24 12/10/18 58,058 1,745,223 (3) 348,347 (3) (4) 239,531 (4) 22,077(5) 774,461 (5) (1) The following table provides the vesting date of theoptions.options vest on May 15, 2012. Timothy R. William A. Mark W. D. Stephen S. Theis Vesting Date Wallace McWhirter Stiles Menzies Rice 05/09/09 8,850 3,600 5,055 4,305 2,040 05/10/09 20,550 4,500 5,610 4,680 1,650 05/09/10 8,850 3,600 5,055 4,305 2,040 05/15/12 85,000 40,000 45,000 45,000 25,000 33(2) Timothy R. William A. Mark W. D. Stephen S. Theis Vesting Date Wallace(a) McWhirter Stiles Menzies Rice 05/09/09 15,094 9,625 13,500 11,500 5,475 05/15/09 38,700 9,820 10,780 10,780 4,440 05/29/09 27,804 4,500 8,000 6,500 2,300 05/11/10 33,046 9,000 14,250 12,350 4,250 05/15/10 41,500 10,987 13,180 13,180 5,273 05/09/11 15,094 9,625 13,500 11,500 5,475 05/15/11 38,700 9,820 10,780 10,780 4,440 05/29/11 27,804 4,500 8,000 6,500 2,300 05/11/12 33,046 9,000 14,250 12,350 4,250 05/15/12 41,500 10,986 13,180 13,180 5,273 05/09/13 15,094 9,625 13,500 11,500 5,475 05/15/13 17,700 4,320 5,280 5,280 2,040 Restricted Shares(b) 130,200 59,850 30,450 7,500 13,500 Vesting Date 33,046 — 12,350 9,000 4,250 73,040 7,420 25,120 22,486 10,313 15,094 1,250 11,500 9,625 5,475 49,240 5,920 17,220 15,820 7,080 31,540 7,920 11,940 11,500 5,040 15,540 13,500 5,500 5,500 2,400 — 15,000 5,000 5,000 5,000 — 10,000 — — — — 3,000 — — — — 3,000 — — — 103,727 — 7,500 44,850 13,500 20,000 5,000 10,000 — 15,000 — (a)On December 30, 2008, Mr. Wallace turned 55 years old and, as a result, met the definition of “early retirement” on December 31, 2008 with respect to 262,750 shares and on January 1 and January 2, 2009, with respect to 88,200 shares. In accordance with the Code, personal income tax associated with the lapse of substantial risk of forfeiture of those shares must be satisfied currently even though the shares have not vested. The terms of the Company’s 2004 Stock Option and Incentive Plan, as amended (the “Plan”), provide that any participant under the Plan who is subject to Section 16 of the Securities Exchange Act of 1934 is required to satisfy his or her tax withholding obligation pursuant to the share retention method. As a result, Mr. Wallace has satisfied his tax withholding obligation by surrendering shares to the Company based on the appropriate federal income tax and payroll tax rates currently applicable. The unvested shares in the table above have been adjusted for the 95,768 shares surrendered December 31, 2008. Additionally, Mr. Wallace surrendered 8,672 shares on January 1, 2009 and 17,801 shares on January 2, 2009. The shares in the table above have not been adjusted for the shares surrendered in 2009. (b)(a)(b) (c) the earlier of death, disability or change in control; or (iv) consent of the HR Committee after three years from the date of grant.(3) thresholdactual value of performance-based shares that couldto be awarded in 2010 if threshold2012 based upon achievement of financial performance goals are achieved for the cumulative performance period 2007 — 2009.in 2010-2011. The actual number of shares to be issued in 20102012 will be based on the value of the award to be granted in 20102012 divided by the one-year average stockCommon Stock price for the period ended March 31, 2010.2012. Vesting of any performance-based shares issued in 20102012 will be determined on or prior to the date of issue.(4) thresholdtarget value of performance-based shares that could be awarded in 20112013 if thresholdtarget financial performance goals are achieved for the cumulative performance in 20082010 — 2010.2012. The actual number of shares to be issued in 20112013 will be based on the value of the award to be granted in 20112013 divided by the one-year average stockCommon Stock price for the period ended March 31, 2011.2013. Vesting of any performance-based shares issued in 20112013 will be determined on or prior to the date of issue.34(5) Option Exercises and Stock Vested in 2008201120082011 (i) the number of shares acquired upon exercise of stock options and the value realized and (ii) the number of shares acquired upon the vesting of restricted stock and restricted stock units and the value realized, each before payout of any applicable withholding tax. Option Awards Stock Awards Number of Number of Shares Value Shares Value Acquired on Realized on Acquired on Realized Exercise Exercise Vesting on Vesting Name (#) ($) (#) ($) Timothy R. Wallace 139,740 $ 3,332,750 75,800 $ 2,632,940 William A. McWhirter 13,499 312,173 15,667 551,243 Mark W. Stiles 8,823 164,696 22,150 773,198 D. Stephen Menzies 25,485 662,015 20,250 709,605 S. Theis Rice — — 7,484 263,523 Name Option Awards Stock Awards 38,250 $ 1,264,163 137,740 $ 3,338,874 2,700 90,018 7,770 253,320 — — 40,720 1,342,226 8,922 311,467 35,445 1,166,394 19,110 622,830 17,255 568,991 Pension Benefits Number Present of Years Value of Credited Accumulated Service Benefit Name Plan Name (#) ($)(1) Timothy R. Wallace Trinity Industries, Inc. Standard Pension Plan 34 $ 373,000 Trinity Industries, Inc. Supplemental Retirement Plan 34 4,690,000 William A. McWhirter Trinity Industries, Inc. Standard Pension Plan 23 140,000 Mark W. Stiles Trinity Industries, Inc. Standard Pension Plan 17 286,000 D. Stephen Menzies Trinity Industries, Inc. Standard Pension Plan 7 72,000 S. Theis Rice Trinity Industries, Inc. Standard Pension Plan 18 254,000 Name Plan Name Trinity Industries, Inc. Standard Plan 34 $ 553,000 — Trinity Industries, Inc. Supplemental Retirement Plan 34 6,902,000 — Trinity Industries, Inc. Standard Plan — 1,000 — Trinity Industries, Inc. Standard Plan 9 140,000 — Trinity Industries, Inc. Standard Plan 23 231,000 — Trinity Industries, Inc. Standard Plan 18 368,000 — (1) SFAS 87.ASC Topic 718. Refer to Note 1314 of Item 8 of the Company’s Annual Report onForm 10-K for the year-ended December 31, 20082011 for ourthe policy and assumptions made in the valuation of this accumulated benefit.35Compensation Table” are not included in covered compensation. The normal monthly retirement benefit payable at age 65 is a life annuity with ten years guaranteed equal to3/4 of 1% of averageAll of the named executive officers participateParticipants in the Standard Pension Plan.We havePlan can choose to receive benefit payments at age 65 even if still employed. If they make such an election, no death benefit is available.ourthe Standard Pension Plan that is limited by reason of compliance with the Code is paid as a supplemental pension benefit. The benefit payment terms are the same as the terms of the Standard Pension Plan. The benefits are payable from the general assets of the Company. On February 13, 2009, the Board amended the Standard PensionSupplemental Retirement Plan and the Standard Pension Plan. As a result, all future benefit accruals under the Supplemental Retirement Plan. These amendments do not affectPlan and the Standard Pension Plan orautomatically ceased effective March 31, 2009 for all participants and the Supplemental Retirement Plan for 2008.accrued benefits under each plan were determined and frozen as of that date. These amendments are discussed in the Compensation Discussion and Analysis section under “Post-employment Benefits.”20082011 and the aggregate balance at year end under nonqualified deferred compensation plans of the Company. Executive Registrant Aggregate Aggregate Contributions Contributions Earnings Balance in Last Fiscal in Last Fiscal in Last Fiscal at Last Fiscal Name Year(1) Year(2) Year(3) Year End(1)(2)(3)(4) Timothy R. Wallace $ 125,357 $ 352,272 $ (274,246 ) $ 2,088,060 William A. McWhirter 18,700 101,691 (5,431 ) 519,306 Mark W. Stiles 23,636 118,702 4,655 624,980 D. Stephen Menzies — 112,982 (28,136 ) 624,696 S. Theis Rice — 67,815 — 67,815 Name $ 87,638 $ 308,706 $ 101,470 $ 3,530,530 27,037 94,672 (3,542 ) 246,156 — 135,000 32,687 1,054,303 14,513 119,756 26,480 966,203 4,300 102,150 9,131 294,290 (1) 2008.2011.(2) ten percent10% of the salaries and incentive compensation set aside pursuant to the DeferredTransition Compensation Plan for Messrs. Wallace $262,114;$285,000; Perry $87,500; Menzies $135,000; McWhirter $92,341; Stiles $112,982; Menzies $112,982;$112,500; and Rice $67,815$100,000; and matching amounts under the Company’s Supplemental Plan for Messrs. Wallace $90,158;$23,706; Perry $7,172; McWhirter $9,350;$7,256; and Stiles $5,720.Rice $2,150. These amounts are also included in the “Summary Compensation Table” for 2008.2011.(3) lossesearnings in the Supplemental Plan and earnings in the DeferredTransition Compensation Plan. For Messrs. Wallace, McWhirter, Stiles, and Menzies, lossesEarnings in the Supplemental Plan were $(356,331)were: Messrs. Wallace $6,346; Perry $(4,951); $(31,193)Menzies $(6,355); $(29,188)McWhirter $(5,742); and $(60,105), respectively. ForRice $(11). Earnings in the Transition Compensation Plan were: Messrs. Wallace $95,124; Perry $1,409; Menzies $39,042; McWhirter Stiles,$32,222; and Menzies, earnings in the Deferred Compensation Plan were $82,085; $25,762; $33,843; and $31,969, respectively.Rice $9,142. The amounts reported in this table for the DeferredTransition Compensation Plan are inclusive of above market earnings included in the “Summary Compensation Table” above. See Note (4)(5) to the “Summary Compensation Table.”(4) DeferredTransition Compensation Plan in 20062010 for Messrs. Wallace $329,337;$150,917; Perry $27,562; Menzies $72,405; McWhirter $98,668; Stiles $130,668;$63,346; and Menzies $128,668Rice $46,944; and in 20072009 for Messrs. Wallace $309,182;$189,050; Menzies $86,320; McWhirter $112,818; Stiles $138,036;$77,563; and Menzies $138,036; Rice $54,066;Profit Sharing Plan in 20062010 for Messrs. Wallace $74,135;36$43,937; Perry $4,784; and McWhirter $4,070; and Stiles $5,390$9,137; and in 20072009 for Messrs. Wallace $79,484;$62,678; and McWhirter $9,350; Stiles $5,720; and Menzies $36,897; and (iii) salary and incentive compensation deferrals to the Company’s Supplemental Profit Sharing Plan in 20062010 for Messrs. Wallace $158,968;$57,625; Perry $12,624; and McWhirter $8,140; Stiles $10,780; and Menzies $80,418$18,275; and in 20072009 for Messrs. Wallace $213,145;$88,825; and McWhirter $18,700; and Stiles $11,440.$18,700.Deferred Compensation Discussionfund likefund-like deemed investments.6six months after termination of employment in lump sum or annual installments from one to 20 years according to election of the Participant.participant.DeferredTransition Compensation Plan which is an unfunded long term plan whereby an amount equal to 10% of salary and annual incentive compensation is set aside in an account on the books of the Company. The account is credited monthly with an interest rate equivalent as determined annually by the HR Committee (83/4%(5% for 2006 and 73/4% for 2007 and 2008)2011). The account is payable to the participant in a lump sum or annual installments from one to 20 years. Payments commence one year after termination and areyears, subject to compliance with non-compete provisions for one year after termination and the participant must be available for consultation for one year after termination.following conditions:(i) (ii) (iii) Potential Payments Upon Termination or Change in Controlus,the Company, salaried employees have a death benefit equal to the greater of their accrued benefit under the pension plan or one year of base salary for less than 10 years of service and 21/2 times base salary for over 10 years ofOurThe Company’s long term disability plan provides salaried employees with a disability benefit after six months of disability of 60% of base salary up to a maximum of $12,000 a month while disabled and until normal retirement at age 65. Pension benefits payable at retirement are described under “Pension Benefits” and deferred compensation benefits that are payable on termination are described under “Deferred Compensation Discussion.”DeferredTransition Compensation Plan, and 401(k) Plan vest upon a change in control. The annual incentive compensation agreements also provide that in the event of a change in control, the named executive officers will be paid a proration of the target bonus for the year in which the change in control occurs as of the date of the change in control.37The following table provides the dollar value of (i) accelerated vesting of stock options and restricted stock and (ii) the payment of annual incentive compensation assuming each of the named executive officers had been terminated by death, disability, or retirement on December 31, 2008,2011, or a change in control occurred on December 31, 2008. Timothy R. William A. Mark W. D. Stephen S. Theis Wallace McWhirter Stiles Menzies Rice Death Stock Options $ — $ — $ 6,096 $ — $ 26,560 Restricted Stock 7,490,444 2,547,730 2,657,924 2,094,504 1,016,378 Total 7,490,444 2,547,730 2,664,020 2,094,504 1,042,938 Disability Stock Options — — 6,096 — 26,560 Restricted Stock 7,490,444 2,547,730 2,657,924 2,094,504 1,016,378 Total 7,490,444 2,547,730 2,664,020 2,094,504 1,042,938 Retirement Stock Options — — 6,096 — 26,560 Restricted Stock 4,683,588 1,232,826 1,819,492 1,256,072 678,074 Total 4,683,588 1,232,826 1,825,588 1,256,072 704,634 Change in Control Stock Options — — 6,096 — 26,560 Restricted Stock 7,490,444 2,547,730 2,657,924 2,094,504 1,016,378 Annual Incentive Compensation
855,000
255,000
312,000
312,000
182,500 Total 8,345,444 2,802,730 2,976,020 2,406,504 1,225,438 2011.
Stock Options $ 1,174,700 $ 172,750 $ 621,900 $ 552,800 $ 345,500 10,307,668 3,045,385 3,089,097 4,337,950 1,892,948 11,482,368 3,218,135 3,710,997 4,890,750 2,238,448
Stock Options 1,174,700 172,750 621,900 552,800 345,500 10,307,668 3,045,385 3,089,097 4,337,950 1,892,948 11,482,368 3,218,135 3,710,997 4,890,750 2,238,448
Stock Options 1,174,700 172,750 621,900 552,800 345,500 5,216,706 166,839 1,141,810 2,074,252 845,868 6,391,406 339,589 1,763,710 2,627,052 1,191,368
Stock Options 1,174,700 172,750 621,900 552,800 345,500 12,583,237 3,496,820 3,785,576 4,918,357 2,408,858 950,000 262,500 405,000 337,500 300,000 14,707,937 3,932,070 4,812,476 5,808,657 3,054,358 ourthe Company’s outstanding common stockCommon Stock or the combined voting power over ourthe Company’s outstanding voting securities unless the transaction resulting in the person becoming the beneficial owner of 30% or more of the combined voting power is approved in advance by the Company’s Board; (ii) the incumbent directors cease for any reason to constitute at least a majority of the Board; (iii) the completion of certain corporate transactions including a reorganization, merger, statutory share exchange, consolidation or similar transaction, a sale or other disposition of all or substantially all of ourthe Company’s assets, or the acquisition of assets or stock of another entity, subject to certain exceptions; or (iv) our shareownersthe stockholders approve a complete liquidation or dissolution of the Company. See “Change in Control Agreements” under Compensation Discussion and Analysis section.38expense; (iii) conviction of the participant of a felony involving moral turpitude; or (iv) the refusal of the participant to accept offered employment after a change in control.benefits, and a lump sum equivalent to the value of an annuity payable at age 65 with 36 months of additional service without regard to limitations imposed by the Code, less the benefit actually accrued under the pension plan. Effective April 1, 2009, all future benefits under the Standard Pension Plan and the Supplemental Retirement Plan automatically ceased for all participants. Accordingly, the lump sum equivalent to the value of an annuity payable at age 65 is no longer applicable.benefits. The Agreements were amended in September 2008 in order to comply with Section 409A of the Code and such amendments did not materially affect the scope or amount of benefits provided.20082011 under one of the circumstances described in the Agreement in connection with a change in control of the Company, the named executive officers would have received the following: Increase in Present Value of Cash Continuation Pension Estimated Name Compensation(1) of Benefits(2) Benefits(3) Gross-up(4) Total Timothy R. Wallace $ 9,749,583 $ 450,526 $ 1,123,000 $ — $ 11,323,109 William A. McWhirter 3,247,206 450,526 936,000 2,249,826 6,883,558 Mark W. Stiles 4,129,396 450,526 2,114,000 2,440,481 9,134,403 D. Stephen Menzies 4,007,227 450,526 717,000 2,057,504 7,232,257 S. Theis Rice 2,496,890 450,526 1,051,000 1,670,299 5,668,715 Name Cash
Continuation of
Benefits(2)
Gross-up(3) Total $ 6,234,556 $ 30,662 $ — $ 6,265,218 1,916,250 46,793 1,778,835 3,741,878 2,956,500 31,367 — 2,987,867 2,508,747 46,793 1,718,648 4,274,188 2,190,000 43,373 1,090,975 3,324,348 (1) (2) (3) Cash lump sum payment for the increase in present value of pension benefits. Effective April 1, 2009, all future benefits under the Standard Pension Plan and the Supplemental Retirement Plan automatically ceased for all participants. Accordingly, the lump sum equivalent to the value of an annuity payable at age 65 is no longer applicable.(4)Mr.Messrs. Wallace and Menzies did not result in excise taxes under Code Section 280G; therefore, nogross-up payments would have been paid if histheir employment had been terminated on December 31, 2008.2011.39Director CompensationThe following table summarizes the compensation paid by the Company to non-employee directors for the fiscal year ended December 31, 2008.2011. Ms. Lovett did not join the Board until 2012 and therefore is not included in the table below. Change in Pension Value and Fees Nonqualified Earned Deferred or Paid Stock Compensation All Other in Cash Awards Earnings Compensation Total Name ($)(1) ($)(2)(3) ($)(4) ($)(5) ($) John L. Adams $ 74,500 $ 103,367 $ 2,113 $ — $ 179,980 Rhys J. Best 93,000 103,367 — — 196,367 David W. Biegler 109,000 103,367 5,681 696 218,744 Leldon E. Echols 87,000 120,454 — 603 208,057 Ronald J. Gafford 80,000 103,367 18,000 2,442 203,809 Ronald W. Haddock 90,000 103,367 — — 193,367 Jess T. Hay 98,500 103,367 — 2,500 204,367 Adrian Lajous 87,000 103,367 — — 190,376 Diana S. Natalicio 73,000 103,367 — 9,268 185,635 Name $ 89,500 $ 147,336 $ 1,597 $ 7,675 $ 246,108 97,083 147,336 — 5,000 249,419 98,000 147,336 3,499 6,083 254,918 112,000 147,336 — 11,038 270,374 80,375 147,336 — 12,186 239,897 81,500 147,336 — 5,000 233,836 32,667 — — 5,000 37,667 84,500 147,336 — — 231,836 79,917 147,336 — 5,000 232,253 71,500 147,336 — 19,943 238,779 93,500 147,336 — 796 241,632 (1) (2) 20082011 and the grant date fair value dollar amounts recognized for financial statement reporting purposes with respect to the fiscal year incomputed accordance with SFAS 123R. OurASC Topic 718. The policy and assumptions made in the valuation of share-based payments are contained in Note 1716 of Item 8 of the Company’sForm 10-K for the year-ended December 31, 2008. The SFAS 123R grant date fair value2011.(3) awards granted in 2008 was $93,070 for each director. The amount reported represents five months of amortization of the grant date fair value of the awards granted during 2007 and seven months of amortization of the grant date fair value of the awards granted during 2008 for Messrs. Adams, Best, Biegler, Gafford, Haddock, Hay, and Lajous and Dr. Natalicio. For Mr. Echols, the amount reported represents nine months of amortization of the grant date fair value of the awards granted during 2007 and seven months of amortization of the grant date fair value of the awards granted during 2008.(3)Messrs. Adams, Best, Biegler, Echols, Gafford, Haddock, Hay, and Lajous and Dr. Nataliciodirectors had restricted stock units totaling 5,505; 9,255; 10,755; 5,349; 10,755; 9,255; 10,755;as follows: Messrs. Adams 20,021; Best 23,771; Biegler 25,271; Echols 19,865; Gafford 25,271; Haddock 23,771; Lajous 22,821; Matthews 13,427; Rock 8,305; and 10,755, respectively,Dr. Natalicio 25,271. Includes the following amounts of stock options as of December 31, 2008.2011: Messrs. Adams, Best 3,750; Biegler Gafford,15,000; Haddock and Hay3,750; and Dr. Natalicio had stock options totaling 81,528; 3,750; 37,500; 26,250; 3,750; 45,000; and 45,000, respectively, as of December 31, 2008.(4)In 2005, the Board of Directors made amendments to the Directors Retirement Plan (the “DRP”) that were designed to discontinue the DRP. Before the addition of the two new directors in 2005, the DRP was amended to exclude new directors, and in December 2005 it was amended to terminate the interest of each fully vested non-employee director as of December 15, 2005, and to make provision to terminate the interest of the remaining directors who were not fully vested. The basic benefit of the DRP before it was amended was a monthly payment for ten years upon retirement, disability or death equal to a percentage of the annual retainer in effect at termination of Board service. The percentage was based upon the number of years of service, starting with 50% after five years of service and increasing 10% for each year up to 100% after ten years. Mr. Gafford is the remaining participating director who was not fully vested on December 15, 2005. He will receive a payout of benefits to the extent vested on the earlier of retirement, death, a change of control as defined by Section 409A of the Code, or after ten years of service on the Board with payment calculated on the same basis as used for termination of the fully vested directors’ interest in the DRP, except that the date for calculation of the present22,500.40(4) value factor will be the date benefits are payable and not December 15, 2005. (5) Mr.Messrs. Adams, Best, Biegler, Echols, Gafford, Haddock, Matthews, Hay and Dr. Natalicio includes a $2,500$5,000 matching contribution by the Company in histheir name pursuant to the Company’s Matching Gifts to Education Program.program of matching charitable contributions. The maximum annual contribution that may be matched under that Programprogram is $5,000 per individual.Director Compensation Discussionreceivesreceived cash compensation in 2011 as follows:• Board member annual retainer of $50,000• Presiding Director — annual retainer of $5,000• Board meeting fee of $2,000 for each meeting attended• Audit Committee Chairman — annual retainer of $15,000• Member of the Audit Committee — $2,000 for each meeting attended• Human Resources Committee Chairman — annual retainer of $7,500• Chairman of other Board Committees — annual retainer of $5,000• Member of other Board Committees — $1,500 for each meeting attendedshall pay a directorpaid directors a fee equal to $2,000 per day for ad hoc or special assignment work performed for or at the request of the Chairman, Chief Executive Officer, and President.InFollowing their election at the Annual Meeting of Stockholders in May 2008,2011, each director who was not also an executive officer of the Company was granted 2,8224,200 restricted stock units, with dividend equivalents, that are convertible into 2,8224,200 shares of common stockCommon Stock upon departure from the Board. The 12 month average share price used to calculate these awards at the time of granting was $23.78 (April 1, 2010 to March 31, 2011). The amount listed in the “Stock Awards” column of the “Director Compensation Table” is the grant date fair value dollar amount computed in accordance with ASC Topic 718. The grant date fair value for these awards was $35.08 per share.athe 2005 Deferred Plan for Director Fees (the “Director Deferred Plan”), to defer the receipt of all or a specified portion of the fees to be paid to him or her. Deferred amounts are credited to an account on the books of the Company and treated as if invested either at an interest rate equivalent (73/4%(5% in 2008 and 5% in 2009)2011) or, at the director’s prior election, in units of the Company’s common stockCommon Stock at the closing price on the New York Stock Exchange on the first tradinglast day of the quarter following the date that a payment is credited to the director’s account.account, or if the last day of the quarter is not a trading day, on the next succeeding trading day. Such stock units are credited with amounts equivalent to dividends paid on the Company’s common stock.Common Stock. Upon ceasing to serve as a director or a change in control, the value of the account will be paid to the director in annual installments not exceeding ten years according to the director’s prior election.TRANSACTIONS WITH RELATED PERSONS Corporate Governance and Directors Nominating Committee has adopted a Policy and Procedures for the Review, Approval, and Ratification of Related Person Transactions. In accordance with the written policy, the Corporate Governance and Directors Nominating Committee, or the chair of such committee, as applicable, is responsible for the review, approval, and ratification of all transactions with related persons that are required to be disclosed under the rules of the SEC. Under the policy, a related person includes any of ourthe Company’s directors, executive officers, certain stockholders, and any of their respective immediate family members. The policy applies to Related Person Transactions which are transactions in which the Company participates, a related person has a direct or indirect material interest, and the amount exceeds $120,000. Under the policy, the Chief Legal Officer (the “CLO”) will review potential transactions and in consultation with the CEO and CFO will assess whether the proposed transaction would be a Related Person Transaction. If the CLO determines the proposed transaction would be a Related Person Transaction, the proposed transaction is submitted to the Corporate Governance and Directors Nominating Committee, or the chair of such committee, as applicable, for review and consideration. In reviewing41Related Person Transactions, the Corporate Governance and Directors Nominating Committee, or the chair of such committee, as applicable, shall consider all relevant facts and circumstances available, including, but not limited to the following:• the benefits to the Company of the Related Person Transaction;• the impact of a director’s independence if the related person is a director, an immediate family member of a director or an entity in which a director is a partner, stockholder or executive officer;• the availability of other sources for comparable products and services;• the terms of the transaction; and• the terms available to unrelated third parties or employees generally. Corporate Governance and Directors Nominating Committee, or the chair of such committee, as applicable, may approve the Related Person Transaction if the committee, or the chair of the committee, as applicable, concludes in good faith that the Related Person Transaction is in, or is not inconsistent with, the best interests of the Company and its stockholders.20082011 in excess of $120,000 are as follows:• Mr. Patrick S. Wallace, brother of Timothy R. Wallace, is an officer of a subsidiary of the Company. His total compensation was $943,652 for 2008, which includes base salary; bonus; matching contributions to defined contribution plans; perquisite allowance; and the dollar amount recognized for financial statement reporting purposes with respect to the fiscal year in accordance with SFAS 123R.• Mr. W. Ray Wallace, father of Timothy R. Wallace, is the Former Chairman and CEO of Trinity Industries, Inc. and is currently employed by the Company to provide consultation to the CEO and the Board and also serves as an Advisory Director of the Company. His total compensation was $216,558 for 2008, which includes base salary; personal use of company aircraft; the dollar value of the lost tax deduction for expenses that exceeded the amount reported as income related to the personal use of the Company’s aircraft; director meeting fees associated with attendance as an Advisory Director; andout-of-pocket medical reimbursement. In connection with Mr. Wallace’s consulting role, the Company provides office space to Mr. Wallace.• Mr. Webb Spradley,son-in-law of Mr. Hay, is employed by the Company in a non-executive officer capacity. His total compensation was $309,241 for 2008, which includes base salary; bonus; matching contributions to a defined contribution plan; and the dollar amount recognized for financial statement reporting purposes with respect to the fiscal year in accordance with SFAS 123R.42Mr. Luis Pardo, brother-in-law of Mr. Antonio Carrillo, a Senior Vice President and Group President of the Company, is an officer of a subsidiary of the Company. His total compensation was $1,142,926 for 2011, which includes base salary; bonus; a contribution to a Mexican statutory pension; perquisite allowance; and the aggregate grant date fair value of all equity awards pursuant to ASC 718.Security Ownership of Certain Beneficial Owners and Managementour common stockthe Company’s Common Stock as of March 20, 2009,16, 2012, except as noted for (i) each person beneficially owning more than 5% of the outstanding shares of our common stock,the Company’s Common Stock, (ii) each director and nominee for director of the Company, (iii) each executive officer of the Company listed in the Summary Compensation Table, and (iv) all of ourthe Company’s directors and executive officers as a group. Except pursuant to applicable community property laws and except as otherwise indicated, each shareholderstockholder possesses sole voting and investment power with respect to its, his or her shares. The business address of each of ourthe Company’s directors and executive officers isc/o Trinity Industries, Inc., 2525 Stemmons Freeway, Dallas, Texas75207-2401. Amount and Nature of Ownership of Percent of Name and Address Common Stock(1) Class Directors: John L. Adams 152,847 * Rhys Best 25,505 * David W. Biegler 50,655 * Leldon E. Echols 5,349 * Ronald J. Gafford 37,005 * Ronald Haddock 25,222 * Jess T. Hay 60,675 * Adrian Lajous 8,305 * Diana S. Natalicio 63,255 * Named Executive Officers: Timothy R. Wallace 1,100,911 (2) 1.4 % William A. McWhirter 202,050 * Mark W. Stiles 240,671 * D. Stephen Menzies 198,834 * S. Theis Rice 111,977 * All Directors and Executive Officers as a Group (21 persons): 2,512,771 3.2 % Other 5% Owners: First Pacific Advisors, LLC 5,551,900 (3) 7.1 % Franklin Resources, Inc. 4,156,122 (4) 5.3 % The Vanguard Group, Inc. 4,227,586 (5) 5.4 % Name 75,913 * 40,021 * 42,671 * 19,865 * 25,271 * 39,738 * 22,821 * 1,977 * 13,427 * 55,271 * 8,305 * 958,989 1.2 % 125,262 * 240,154 * 207,047 * 114,505 * 2,182,091 2.7 % 6,022,929 (2) 7.5 % 4,862,578 (3) 6.1 % 4,316,238 (4) 5.4 % 4,305,597 (5) 5.4 % 4,294,260 (6) 5.4 % 4,290,880 (7) 5.3 % 4,102,723 (8) 5.1 % * *(1) 20, 2009,16, 2012, or within 60 days thereafter, as follows: Adams 65,505;13,005;27,521; Biegler 48,255;40,271; Echols 5,349;19,865; Gafford 37,005;25,271; Haddock 13,005; Hay 55,755;27,521; Lajous 22,821; Lovett 1,977; Matthews 13,427; McWhirter 40,000; Menzies 45,000; Perry 12,500; Natalicio 40,271; Rice 25,000; Rock 8,305; McWhirter 8,100; Menzies 8,985; Natalicio 55,755; Rice 17,070; Stiles 22,707; Wallace 29,400;85,000; and all directors and executive officers as a group 426,701.491,101. Includes shares indirectly held through the Company’s 401(k) Plan as follows: Wallace 2,539;1,783; Perry 90; McWhirter 1,204;1,210; Rice 2,307;2,061; and all executive officers as a group 6,1826,478 shares. Certain executive officers and directors maintain margin securities accounts, and the positions held in such margin accounts, which may from time to time include shares of Common Stock, are pledged as collateral security for the repayment of debit balances, if43any, in the accounts. At March 20, 2009, one executive officer16, 2012, no directors or officers had 28,109 shares in a margin account with outstanding credit lines or loans and one director had 3,000any shares pledged on a revolving line of credit.as security for any such debit balances.(2) Includes 57,688held indirectlyowned by limited partnerships which Mr. Wallace controls.such clients. Lord, Abbett & Co. LLC also stated that it had sole voting power over 5,715,303 shares and sole dispositive power over 6,022,929 shares.(3) CaliforniaCA 90064, reported to the SEC on an Amendment to Schedule 13G filed February 11, 2009,14, 2012, that First Pacific Advisors, LLC, in its capacity as investment adviser to its various clients, may be deemed to be the beneficial owner of 5,551,9004,862,578 shares owned by such clients, as in its capacity as investment adviser it has the power to dispose, direct the disposition of, and vote the shares of the Company owned by its clients. First Pacific Advisors, LLC also stated that Robert L. Rodriguez, and J. Richard Atwood, and Steven T. Romick are part-owners and managing members of First Pacific Advisors, LLC, and as controlling persons, they may be deemed to beneficially own 5,551,9004,862,578 shares owned by clients of First Pacific Advisors, LLC, and that First Pacific Advisors, LLC and its affiliates had shared voting power over 2,171,0502,171,200 shares and shared dispositive power over all 5,551,9004,862,578 shares.(4) (5) (6) (7) CaliforniaCA 94403-1906, reported to the SEC on an Amendment to Schedule 13G filed February 9, 2009,2012, that certain affiliates of Franklin Resources, Inc. and its affiliates may be deemed to be the beneficial owners of 4,290,880 shares and have sole voting power over 4,050,3004,152,880 shares and sole dispositive power over 4,103,0004,288,080 shares. These shares are beneficially owned by one or more open- or closed-end investment companies or other managed accounts that are investment management clients of investment managers that are direct and indirect subsidiaries of Franklin Resources, Inc. Related investment management contracts give these subsidiaries of Franklin Resources, Inc. all investment and/or voting power over these shares, so subsidiaries of Franklin Resources, Inc. may be deemed to be the beneficial owners of the shares. Charles B. Johnson and Rupert H. Johnson, Jr. each own in excess of ten percent of the outstanding common stock of Franklin Resources, Inc., and thus may be deemed to be beneficial owners of shares held by persons and entities for whom or for which subsidiaries of Franklin Resources, Inc. provide investment management services.(5)(8)The Vanguard Group, Inc., 100 Vanguard Blvd., Malvern, Pennsylvania 19355,on February 13, 2009,14, 2012, that The Vanguard Group, Inc. has38,0193,998,385 shares and sole dispositive power over 4,227,586all 4,102,723 shares. Vanguard Fiduciary Trust Company, a wholly-owned subsidiary of The Vanguard Group, Inc., is the beneficial owner and directs the voting of 38,019 shares as a result of its serving as investment manager of collective trust accounts.44ADDITIONAL INFORMATIONSection 16(a) Beneficial Ownership Reporting ComplianceSecurities and Exchange Commission (“SEC”).SEC. These reports are also filed with the New York Stock Exchange, and a copy of each report is furnished to the Company.2011.2008.Stockholder Proposals for the 20102013 Proxy Statement20102013 Annual Meeting of Stockholders, for inclusion in the Company’s Proxy Statement and form of proxy relating to the meeting, must be received by the Company at its offices in Dallas, Texas, addressed to the Corporate Secretary of the Company, no later than December 2, 2009.November 30, 2012. Upon timely receipt of any such proposal, the Company will determine whether or not to include such proposal in the proxy statement and proxy in accordance with applicable regulations and provisions governing the solicitation of proxies.Director Nominations or Other Business for Presentation at the 20102013 Annual Meeting5, 2010,1, 2013, but no earlier than February 3, 2010,January 30, 2013, for the 20102013 Annual Meeting) to the Corporate Secretary of the Company containing the name and address of the stockholder, the number of shares of the Company beneficially owned by the stockholder, and a representation that the stockholder intends to appear in person or by proxy at the meeting. If the notice relates to a nomination for director, it must also set forth the name and address of any nominee(s), all arrangements or understandings between the stockholder and each nominee and any other person or person(s) (including their names) pursuant to which the nomination(s) are to be made, such other information regarding each nominee as would have been required to be included in a proxy statement filed pursuant to the proxy rules of the SEC had each nominee been nominated by the Board, and the consent of each nominee to serve. The Company may require any proposed nominee to furnish such other information as may reasonably be required by the Company to determine the eligibility of such proposed nominee to serve as director. Notice of an item of business shall include a brief description of the proposed business and any material interest of the stockholder in such business.Corporate Governance and Directors Nominating Committee for nomination by the Board.Report onForm 10-K2008,2011, as filed with the Securities and Exchange Commission, including financial statements, was included with the Annual Report mailed to each stockholder. Stockholders may obtain without charge another copy of theForm 10-K, excluding certain45exhibits, by writing to Paul M. Jolas, DeputyJared S. Richardson, Associate General Counsel and Corporate Secretary, Trinity Industries, Inc., 2525 Stemmons Freeway, Dallas, Texas 75207.OTHER BUSINESSBy Order of the Board of DirectorsPAUL M. JOLASDeputy General Counseland Corporate SecretaryApril 1, 200946
ANNUAL MEETING OF STOCKHOLDERS OF By Order of the Board of Directors 
May 4, 2009 PROXY VOTING INSTRUCTIONS— Access “www.voteproxy.com”- www.proxyvote.comfollowfor electronic delivery of information up until 11:59 P.M. Eastern Time the on-screen instructions.day before the cut-off date or meeting date. Have your proxy card availablein hand when you access the web page, and use the Company Number and Account Number shown on your proxy card. TELEPHONE — Call toll-free 1-800-PROXIES (1-800-776-9437) in the United States or 1-718-921-8500 from foreign countries from any COMPANY NUMBER touch-tone telephonesite and follow the instructions.instructions to obtain your records and to create an electronic voting instruction form.availablein hand when you call and usethen follow the Company Numberinstructions.Account Number shown on your proxy card. ACCOUNT NUMBER Vote online/phone until 11:59 PM EDT the day before the meeting. MAIL — Sign, date and mail your proxy card and return it in the postage-paid envelope we have provided as soon as possible. IN PERSON — You may vote your shares in person by attending the Annual Meeting. NOTICE OF INTERNET AVAILABILITY OF PROXY MATERIAL: The Notice of Meeting, proxy statement and proxy card are available at www.proxydocs.com/trn Please detach along perforated line and mail in the envelope provided IF you are not voting via telephone or the Internet. —— —— 21030000000000000000 0 050409 THE DIRECTORS RECOMMEND VOTING “FOR” EACH OF THE NOMINEES FOR DIRECTOR AND “FOR” PROPOSAL 2. PLEASE SIGN, DATE AND RETURN PROMPTLY IN THE ENCLOSED ENVELOPE. PLEASEreturn it to Vote Processing, c/o Broadridge, 51 Mercedes Way, Edgewood, NY 11717.TO VOTE, MARK YOUR VOTEBLOCKS BELOW IN BLUE OR BLACK INK AS SHOWN HERE xFOLLOWS:KEEP THIS PORTION FOR AGAINST ABSTAIN YOUR RECORDSDETACH AND RETURN THIS PORTION ONLY THIS PROXY CARD IS VALID ONLY WHEN SIGNED AND DATED. For All To withhold authority to vote for any individual nominee(s), mark “For All Except” and write the number(s) of the nominee(s) on the line below. The Board of Directors recommends you vote FOR the following: ¨ ¨ ¨ ten (10) Directors: 2.DirectorsThe Board of Directors recommends you vote FOR proposals 2 and 3. For Against Abstain ¨ ¨ ¨ ratification of the appointmentratification of Ernst & Young LLP as Independent Registered Public Accounting Firm for fis-NOMINEES: calfiscal year ending December 31, 2009. FOR ALL NOMINEES O John L. Adams O Rhys J. Best 3. In their discretion on such2012.¨ ¨ ¨ NOTE:Such other mattersbusiness as may properly come before the meeting. WITHHOLD AUTHORITY O David W. Biegler FOR ALL NOMINEES O Leldon E. Echols O Ronald J. Gafford FOR ALL EXCEPT O Ronald W. Haddock (See instructions below) O Jess T. Hay O Adrian Lajous O Diana S. Natalicio O Timothy R. Wallace INSTRUCTIONS: To withhold authority to vote formeeting or any individual nominee(s), mark “FOR ALL EXCEPT” and fill in the circle next to each nominee you wish to withhold, as shown here: JOHN SMITH 1234 MAIN STREET APT. 203 NEW YORK, NY 10038 To change the address on your account, please check the box at right and indicate your new address in the address space above. Please note that changes to the registered name(s) on the account may not be submitted via this method. Signature of Stockholder Date: Signature of Stockholder Date: Note: adjournment thereof.
Please sign exactly as your name or names appear on this Proxy. When shares are held jointly, each holder should sign.name(s) appear(s) hereon. When signing as attorney, executor, administrator, attorney, trustee or guardian,other fiduciary, please give full title as such. Joint owners should each sign personally. All holders must sign. If the signer is a corporation please sign full corporate name by duly authorized officer, giving full title as such. If signer is aor partnership, please sign in full corporate or partnership name, by authorized person.officer.Signature [PLEASE SIGN WITHIN BOX] Date Signature (Joint Owners) Date 
— . . . . . . . . . . . . . . . . . . . . . . . . . . . . . . . . . . . . . . . . . . . . . . . . . . . . . —— 0 
— May 4, 2009 - April 30, 20121-800-PROXIES,1-800-690-6903, or via the Internet at WWW.VOTEPROXY.COMWWW.PROXYVOTE.COM. Have your proxy card in hand and follow the simple instructions. Use the Company Number and Account Number shown on your proxy card. Jess T. HayRhys J. Best and Paul M. JolasJared S. Richardson and each of them with full power of substitution, attorneys, agents and proxies (“agents”) of the undersigned to vote as directed on the reverse side the shares of stock which the undersigned would be entitled to vote, if personally present, at the Annual Meeting of Stockholders of Trinity Industries, Inc. to be held at its offices, 2525 Stemmons Freeway, Dallas, Texas 75207, on Monday, May 4, 2009April 30, 2012 at 8:30 a.m. Central Daylight Time, and at any adjournment or adjournments thereof. If more than one of the above agents shall be present in person or by substitution at such meeting or at any adjournment thereof, the majority of said agents so present and voting, either in person or by substitution, shall exercise all of the powers hereby given. The undersigned hereby revokes any proxy or proxies heretofore given to vote upon or act with respect to such shares of stock and hereby ratifies and confirms all that said agents, their substitutes, or any of them, may lawfully do by virtue hereof. THIS PROXY, WHEN PROPERLY EXECUTED, WILL BE VOTED IN THE MANNER DIRECTED HEREIN BY THE UNDERSIGNED. IF NO DIRECTION IS MADE, THIS PROXY WILL BE VOTED “FOR” EACH OF THE NAMED NOMINEES FOR DIRECTOR AND “FOR” PROPOSAL 2. (ContinuedContinued and to be signed on the reverse side) 14475side
ANNUAL MEETING OF STOCKHOLDERS OF TRINITY INDUSTRIES, INC. May 4, 2009 NOTICE OF INTERNET AVAILABILITY OF PROXY MATERIAL: The Notice of Meeting, proxy statement and proxy card are available at www.proxydocs.com/trn Please sign, date and mail your proxy card in the envelope provided as soon as possible. Please detach along perforated line and mail in the envelope provided. — —— 21030000000000000000 0 050409 THE DIRECTORS RECOMMEND VOTING “FOR” EACH OF THE NOMINEES FOR DIRECTOR AND “FOR” PROPOSAL 2. PLEASE SIGN, DATE AND RETURN PROMPTLY IN THE ENCLOSED ENVELOPE. PLEASE MARK YOUR VOTE IN BLUE OR BLACK INK AS SHOWN HERE x FOR AGAINST ABSTAIN 1. Election of ten (10) Directors: 2. To approve ratification of the appointment of Ernst & Young LLP as Independent Registered Public Accounting Firm for NOMINEES: fiscal year ending December 31, 2009. FOR ALL NOMINEES O John L. Adams O Rhys J. Best 3. In their discretion on such other matters as may properly come before the meeting. WITHHOLD AUTHORITY O David W. Biegler FOR ALL NOMINEES O Leldon E. Echols O Ronald J. Gafford FOR ALL EXCEPT O Ronald W. Haddock (See instructions below) O Jess T. Hay O Adrian Lajous O Diana S. Natalicio O Timothy R. Wallace INSTRUCTIONS: To withhold authority to vote for any individual nominee(s), mark “FOR ALL EXCEPT” and fill in the circle next to each nominee you wish to withhold, as shown here: To change the address on your account, please check the box at right and indicate your new address in the address space above. Please note that changes to the registered name(s) on the account may not be submitted via this method. Signature of Stockholder Date: Signature of Stockholder Date: Note: Please sign exactly as your name or names appear on this Proxy. When shares are held jointly, each holder should sign. When signing as executor, administrator, attorney, trustee or guardian, please give full title as such. If the signer is a corporation, please sign full corporate name by duly authorized officer, giving full title as such. If signer is a partnership, please sign in partnership name by authorized person.